Difference between revisions of "Testing Article1"
| Line 1: | Line 1: | ||
| − | ==About | + | ==About Multiple Swimlane Levels== |
| − | + | OnePager version 7.0 features a dramatic increase in visual capability by providing you the ability to display up to three (3) '''swimlane levels''' in your charts. Previous versions of OnePager Pro and Express featured only one '''swimlane level''' with multiple rows grouped within this one '''swimlane level'''. | |
| − | == | + | ==Multiple Swimlane Levels - Example == |
| − | + | Perhaps the best way to familiarize you with this new capability is to provide an example of how '''multiple swimlane levels''' can be used to organize your chart. Using the BlueGrass Project’s Microsoft Project '''source plan''' shown below, we can create a chart with '''three swimlane levels''': | |
| − | <center>[[File:P70- | + | <center>[[File:P70-0_4_1-70-(1)-03102020.png]]</center> |
| − | <!--<center>P70- | + | <!--<center>P70-0_4_1-70-(1)-03102020.png</center>--> |
| − | + | ===Getting Started=== | |
| − | + | Before jumping into the example, perhaps some terminology should be explained from the chart above. | |
| − | + | The illustration above is our '''BlueGrass Project Plan''' with standard Microsoft Project fields with names that are typically used. However, in the example we are going to construct the '''multiple swimlane level''' chart with three '''swimlane levels''' and two '''text columns''' as follows: | |
| − | + | :1) The '''Text30''' MS Project '''source plan''' field is used to represent the '''highest swimlane level''' called '''Left#1''', as you’ll see in the '''Chart Properties form'''. This '''swimlane level''' represents the '''Phases''' of the project. | |
| − | + | :2) As shown in the above illustration, the '''Level 1 summary name''' component of the MS Project '''source plan '''is the next '''highest swimlane level''' called '''Left#2'''. | |
| − | + | :3) For the '''lowest swimlane level''' shown in the chart or '''Left#3''', we use the '''Resource Names''' field from the MS Project '''source plan'''. | |
| − | + | :4) Additionally, the chart with '''multiple swimlane levels''' uses the '''Start''' and '''Finish '''fields form the MS Project '''source plans '''to display two '''text columns''' in the chart called '''Left#1''' and '''Left#2''', respectively. | |
| − | + | ||
| − | + | If you are not using one of OnePager Pro’s standard '''Template Properties''' forms, these settings must be updated into the '''Chart Properties '''form after the basic chart is created. However, what is done here in the interest of speeding this example along is to create a '''Template Properties''' form specifically for this chart and establish the settings within this '''Template Properties '''form as described above. As part of the creation of this '''Template Properties''' form, we show the contents of the '''Swimlane''' and '''Text Column Formatting '''forms to demonstrate where '''swimlane level headings''' and '''text column headings''' are established for the chart. | |
| − | + | ===Setting Up the Template Properties Form=== | |
| − | + | ====Showing the Left#1 Swimlane Level==== | |
| − | + | ||
| − | + | The next series of illustrations display the '''Template Properties '''form’s '''Rows/Swimlanes''' tab at the three '''swimlane levels''' ('''Left#1 '''through '''Left#3''') and the two '''Text Column '''sub-tabs for '''Left#1 '''and '''Left#2'''. | |
| − | + | The illustration below shows the '''Template Properties '''form’s '''Rows/Swimlanes '''tab and the '''Left#1''' '''swimlane level''' sub-tab along with the '''Swimlane Formatting – Left#1 '''form which was accessed by clicking the '''Swimlane Formatting … '''button shown below: | |
| − | + | ||
| − | + | <center>[[File:P70-0_4_1-70-(2)-03102020.png]]</center> | |
| + | <!--<center>P70-0_4_1-70-(2)-03102020.png</center>--> | ||
| − | + | :1) At '''Step 1''' shown above, the '''Left#1 '''sub-tab of the tab in the '''Swimlanes '''control group shows that the '''Group by '''checkbox is checked '''ON''' and the dropdown list of MS Project '''source plan field names''' were used to select the '''Text30''' MS Project '''source plan field''' to '''group '''rows into this '''swimlane level'''. | |
| − | + | ||
| − | + | :2) '''Step 2''' shows that the '''Swimlane Formatting…''' button was clicked to access the '''Swimlane Formatting '''form for '''Left#1'''; the name of the form being expanded so it is clear which '''swimlane level''' is the focus. | |
| − | + | :3) '''Step 3''' shows that the '''Make heading automatically''' checkbox is checked '''OFF''', '''enabling''' the '''Custom heading: '''window where we’ve typed in the term '''Phrase''' which appears in '''The Corner''' of the chart on top of the '''Left#1 swimlane level '''column. | |
| − | + | :4) '''Step 4''' has the '''Label by:''' checkbox checked '''ON''' which is the '''show/no show switch''' for this '''swimlane level'''. Normally, the '''enabled '''window displays the '''source plan field''' that is used to populate the '''swimlane level''' and its '''cells'''. You do have the option to change this selection to another '''source plan field''' if necessary by using the dropdown list. | |
| − | + | :5) Note that the '''Swimlane Formatting – Left#1 '''form provides controls for managing the '''label/text''' for the '''Column Heading''', '''Swimlane Text''' in each of the '''swimlane level cells''', and controls for managing '''Swimlane Borders'''. | |
| − | + | ||
| − | + | :6) After completing the settings for the '''Swimlane Formatting – Left#1''' form, click the '''OK '''button at the bottom of the form to return to the '''Rows/Swimlanes '''tab where you can continue '''editing'''. | |
| − | + | ====Showing the Left#2 Swimlane Level==== | |
| − | + | Continuing with the definition of '''swimlane levels''' process, the illustration below shows the '''Template Properties '''form’s '''Rows/Swimlanes '''tab and the '''Left#2''' '''swimlane level''' sub-tab along with the '''Swimlane Formatting – Left#2 '''form which was accessed by clicking the '''Swimlane Formatting … '''button shown below: | |
| − | + | ||
| − | + | <center>[[File:P70-0_4_1-70-(3)-03102020.png]]</center> | |
| + | <!--<center>P70-0_4_1-70-(3)-03102020.png</center>--> | ||
| − | + | :1) The illustration above parallels the previous illustration for the '''Left#1 swimlane level''' where the '''Group by''' checkbox is checked '''ON''', the '''Left#2 swimlane level''' the '''Group by''' field is '''Level 1 summary name''', and in the '''Swimlane Formatting – Left#2''' form we are using the term '''Sub-Phase''' as to the '''swimlane level heading''' for the '''Left#2 swimlane level'''. | |
| − | + | :2) The contents of the '''Swimlane Formatting – Left#2 '''form are identical for each '''swimlane level'''. | |
| − | + | ||
| − | + | :3) After completing the settings for the '''Swimlane Formatting – Left#2''' form, click the '''OK '''button at the bottom of the form to return to the '''Rows/Swimlanes '''tab where you can continue '''editing'''. | |
| − | ==== | + | ====Showing the Left#3 Swimlane Level==== |
| − | + | To complete the definition of the '''three swimlane levels''', click the '''Lef#3 '''sub-tab in the '''Swimlanes '''control group of the '''Rows/Swimlanes '''tab as shown below: | |
| − | <center>[[File:P70- | + | <center>[[File:P70-0_4_1-70-(4)-03102020.png]]</center> |
| − | <!--<center>P70- | + | <!--<center>P70-0_4_1-70-(4)-03102020.png</center>--> |
| − | + | :1) Clicking the '''Left#3 '''sub-tab shown in Step 1 above, the '''Group by '''checkbox is checked '''ON''' and the '''Resource Names''' MS Project '''source plan field''' is selected for the '''Left#3 swimlane level'''. | |
| − | : | + | :2) After clicking the '''Swimlane Formatting… '''button shown at '''Step 2''' and accessing the '''Swimlane Formatting – Left#3''' form, note that the '''Make heading automatically''' checkbox is checked '''ON'''. This action '''disables''' the '''Custom heading: '''window and tells OnePager to use '''Resource Names''' for '''swimlane level''' '''heading '''for '''Left#3'''. |
| − | + | ||
| − | + | ||
| − | + | ||
| − | : | + | |
| − | + | ||
| − | + | :3) After completing the '''Swimlane Formatting – Left#3''' form, click the '''OK''' button to return to the '''Rows/Swimlanes '''tab. | |
| − | + | This completes the definition of the '''three swimlane levels''' for this '''Template Properties''' form and we can move to the '''Text Columns '''control group on the '''Rows/Swimlanes '''tab to define the two '''text columns''' for this series of charts as described below. | |
| − | === | + | ====Showing the Left#1 Text Column==== |
| − | + | Setting up the definition for '''text columns '''has not changed from previous versions of OnePager. However, the controls are reorganized and, like the '''swimlane level''' definition, a '''Text-Column Formatting – Left#n '''form is provided for each of the five (5) '''text columns''' you can define for a chart as shown below for '''text column Left#1''': | |
| − | + | <center>[[File:P70-0_4_1-70-(5)-03102020.png]]</center> | |
| + | <!--<center>P70-0_4_1-70-(5)-03102020.png</center>--> | ||
| − | + | :1) In '''Step 1''' above, the '''Left#1 text column '''sub-tab is selected and the '''Display data from '''checkbox is checked '''ON '''and used with the adjoining dropdown menu to select the MS Project '''Start source plan field''' for this '''text column'''. | |
| − | + | :2) In '''Step 2''', the action is to click the '''Text Column Formatting… '''button to access the '''Text-Column Formatting – Left#1 '''form. | |
| − | + | :3) In '''Step 3''', we’ve let OnePager create the '''text column Left#1 heading''' by making sure the '''Make heading automatically''' checkbox is checked '''ON'''. | |
| − | + | :4) Again, as an option, '''Step 4''' shows that in the '''Text-Column Formatting – Left#1 '''form you can use the '''Display data from '''dropdown menu in the '''Column Text '''control group to change the '''source plan '''field. | |
| − | + | :5) When finished with the '''Text-Column Formatting – Left#1 '''form, click the '''OK '''button to return to the '''Rows/Swimlanes '''tab. | |
| − | + | ====Showing the Left#2 Text Column==== | |
| − | + | We finish up our example with the definition of '''Text Column Left#2''' as shown in the '''Rows/Swimlanes '''form at the '''Left#2 '''sub-tab in the '''Text Columns''' control group shown below: | |
| − | <center>[[File:P70- | + | <center>[[File:P70-0_4_1-70-(6)-03112020.png]]</center> |
| − | <!--<center>P70- | + | <!--<center>P70-0_4_1-70-(6)-03112020.png</center>--> |
| − | + | :1) Looking at the '''Left#2 '''sub-tab in the '''Text Columns '''control group of the '''Rows/Swimlanes''' tab in '''Step 1''', the '''Display data from''' checkbox is checked '''ON''' and the dropdown window shows that the MS Project '''source plan Finish field''' is selected. | |
| − | + | :2) For '''Step 2''', clicking the '''Text Column Formatting… '''button to access the '''Text-Column Formatting – Left#2 '''form shows that the '''Make headings automatically '''checkbox is checked '''ON '''so OnePager creates the '''text column heading''' for '''Left#2'''. | |
| − | + | :3) In '''Step 3''', the '''Finish source plan field''' is displayed in the form’s '''Column Text '''control group and the window is available to access the dropdown menu to change the selection. | |
| − | + | ||
| − | + | :4) When finished with the '''Text-Column Formatting – Left#2 '''form, click the '''OK '''button to return to the '''Rows/Swimlanes '''tab. | |
| − | + | This completes the settings for '''swimlane levels''' and '''text columns''' in this '''Template Properties''' form. Once finished, click the '''Use '''button and the '''Template Properties '''form becomes the current '''Template Properties '''for the creation of chart. | |
| − | === | + | ===Creating the Chart=== |
| − | + | Creating the chart after the '''Template Properties '''form is configured, made the current '''Template Properties '''form, and the MS Project '''source plan '''identified, it is a matter of using one of the OnePager Pro or Express '''basic workflows''' to create the chart. | |
| − | + | For more information on '''Basic Workflows''', please see the articles at: [[Basic Workflows for Version 7.0 (Portal) | Basic Workflows (Portal)]] <!--7.0.1-70--> | |
| − | <!-- | + | |
| − | + | We’ve gone through that process with the current '''Template Properties '''form and used the BlueGrass Project '''source plan '''to create a chart that looks like this: | |
| − | <center>[[File:P70- | + | <center>[[File:P70-0_4_1-(7)-06112020.png]]</center> |
| − | <!--<center>P70- | + | <!--<center>P70-0_4_1-(7)-06112020.png</center>--> |
| − | + | In the chart above, the '''swimlane levels''', the '''swimlane level headings''', the '''swimlane level cells''', the '''text column headings''', and the '''text column cells''' all correspond to the definitions in the '''Template Properties''' form we updated. There is a lot of information in the chart above with respect to '''swimlane levels''' and the''' graph''' is organized such that '''task bars''' are presented as '''descending''' from left to right by '''Start Date'''. | |
| − | + | If we assume for a moment that '''senior executives''' are interested in the entire project but at the '''Phase''' level, the chart above can be configured into a single '''swimlane level''' chart just displaying the '''Left#1 swimlane level''' by going to the '''Chart Properties '''form’s '''Rows/Swimlanes '''tab and turning '''OFF''' the '''Label by '''checkbox in the corresponding '''Swimlane Formatting – Left#2''' and '''Swimlane Formatting – Left#3 '''forms as shown for the '''Left#3 '''swimlane level below: | |
| − | <center>[[File:P70- | + | <center>[[File:P70-0_4_1-70-(8)-03112020.png]]</center> |
| − | <!--<center>P70- | + | <!--<center>P70-0_4_1-70-(8)-03112020.png</center>--> |
| − | When | + | When these two '''Chart Properties '''form changes are made, the chart looks like this: |
| − | <center>[[File:P70- | + | <center>[[File:P70-0_4_1-(9)-06112020.png]]</center> |
| − | <!--<center>P70- | + | <!--<center>P70-0_4_1-(9)-06112020.png</center>--> |
| − | ''' | + | In a similar way the '''swimlane levels''' defined for this chart can be reconfigured to focus the content on middle management that might be more interested in the '''Sub-Phases''' and '''Resource Names'''. By checking the '''Label by''' checkboxes to '''ON''' in the '''Swimlane Formatting – Left#2 '''and '''Left#3 '''forms and unchecking the '''Label by '''checkbox for the '''Swimlane Formatting –Left #1 '''form '''OFF''' the chart looks like the one below: |
| − | <center>[[File:P70- | + | <center>[[File:P70-0_4_1-(10)-06112020.png]]</center> |
| − | <!--<center>P70- | + | <!--<center>P70-0_4_1-(10)-06112020.png</center>--> |
| − | + | In the above chart, middle managers can see the '''Sub-Phase''' organization and the '''Resource Names''' assigned without the need to have the '''Phase swimlane level''' in view. Throughout these simple modifications of the chart, the organization of the '''row''' and '''task bars''' remained the same. | |
| − | + | ==Manual Editing With Multiple Swimlane Levels - Example== | |
| − | + | ||
| − | + | The example above showed how '''editing '''within the '''Template Properties ''' and '''Chart Properties''' forms can '''globally edit''' the chart. In this section we’ll cover the methods for selecting and '''editing''' both '''swimlane level and text column level components''' (i.e., '''headings''', '''cells''', '''swimlanes''', and '''rows'''). You can select and '''edit''' individual '''swimlane level heading cells''' and '''text column heading cells''' in '''The Corner''' as well as individual '''swimlane level cells''' where these terms are defined in the chart shown below: | |
| − | + | <center>[[File:P70-0_4_1-(11)-06112020.png]]</center> | |
| + | <!--<center>P70-0_4_1-(11)-06112020.png</center>--> | ||
| − | + | ===Selection Methods Available for Multiple Swimlane Levels=== | |
| − | + | ||
| − | + | Before discussing the available features for individually '''editing''' '''swimlane level cells''' and '''swimlane''' properties, '''text columns''' and their properties, we need to emphasize that the selection methods available from previous versions of OnePager Pro and Express are the same with OnePager version 7.0. | |
| − | + | ====The Single Left-Click Option==== | |
| − | + | This means that you retain the capability to use the '''left-click''' in a '''swimlane level heading cell''', a '''swimlane''', a '''text column heading cell''', and a '''text column cell and its row''' to individually select these '''elements''' in the chart and '''graph'''. Selecting a '''row''' requires that at least one '''text column''' be showing in the chart so that the '''left-click '''to select a '''row''' has a position where the '''row''' can be selected. Performing a '''left-click''' in '''empty space '''in the''' graph''' is not supported in OnePager version 7.0. '''Left-clicking''' in '''swimlane''' and '''text column''' '''cells''' is primarily done to select '''swimlane '''and '''rows '''for '''dragging and dropping '''actions to reorganize them in the chart. '''Left-clicking '''in these components is also a way of selecting before using the '''right-click '''to access the '''component’s '''right-click '''context menu'''. The '''right-click '''and '''context menu''' discussions are presented in a later section. | |
| − | + | ====The Slow Left-Click Option==== | |
| − | + | ||
| − | + | ||
| − | + | ||
| − | + | ||
| − | + | ||
| − | + | ||
| − | + | The '''slow left-click''' is a technique available in OnePager version 7.0 for distinguishing between the intent to select an entire '''swimlane''', for example at any level, and selecting a particular '''swimlane level cell'''. When the '''slow left-click '''technique is used on '''swimlane level cell''', the first '''left-click '''in a '''swimlane level cell''' selects the '''swimlane level cell''' and its '''swimlane''' in accordance with the '''swimlane level''' being selected as shown here: | |
| − | <center> | + | <center>'''First Left-Click on a Swimlane Level Cell'''</center> |
| − | + | <center>[[File:P70-0_4_1-(11A-1)-06102020.png]]</center> | |
| − | + | <!--<center>P70-0_4_1-(11A-1)-06102020.png</center>--> | |
| − | + | ||
| − | + | ||
| − | + | ||
| − | + | ||
| − | + | ||
| − | </center> | + | |
| − | + | The '''second''' '''left-click '''part of the '''slow left-click '''technique results in the '''swimlane level cell''' being selected as shown below: | |
| − | + | <center>'''Second Left-Click on a Swimlane Level Cell'''</center> | |
| + | <center>[[File:P70-0_4_1-(11B-1)-06102020.png]]</center> | ||
| + | <!--<center>P70-0_4_1-(11B-1)-06102020.png</center>--> | ||
| − | + | When the '''slow left-click '''technique is used with '''text columns''', the first '''left-click '''in a '''text column cell''' selects the '''text column cell''' and its '''row''' as shown here: | |
| − | + | ||
| − | + | <center>'''First Left-Click on a Text Column Cell'''</center> | |
| + | <center>[[File:P70-0_4_1-(11C-1)-06102020.png]]</center> | ||
| + | <!--<center>P70-0_4_1-(11C-1)-06102020.png</center>--> | ||
| − | + | The '''second''' '''left-click '''part of the '''slow left-click '''technique results in just the '''text column cell''' being selected as shown below: | |
| − | + | <center>'''Second Left-Click on a Text Column Cell'''</center> | |
| + | <center>[[File:P70-0_4_1-(11D-1)-06102020.png]]</center> | ||
| + | <!--<center>P70-0_4_1-(11D-1)-06102020.png</center>--> | ||
| − | + | With '''text columns''', doing a '''left-click '''in one '''text column cell '''when more than one '''text column '''is '''showing''' selects all '''text column cells in the row'''. To use the '''slow double-left-click '''effectively, perform the first '''left-click '''in the '''text column cell''' you wish to ultimately select. Once you make an individual '''swimlane level cell''' or '''text column cell '''selection with this option, OnePager remains in the '''slow left- click '''mode and you cannot select an entire '''swimlane''' or '''text column’s row'''. To exit the '''slow left-click''' mode, perform one '''left-click''' in '''empty space''' in the graph. The '''right-click '''selection methods and discussed in a later sub-section below. | |
| − | + | ||
| − | + | ||
| − | + | ||
| − | + | ||
| − | + | ||
| − | + | ||
| − | + | ====The CTL+Left-Click Option==== | |
| − | + | The '''CTL+Left-Click''' option is used to select '''multiple individual swimlanes''' by first selecting the '''first swimlane''' with a '''left-click '''in the desired '''swimlane level cell''' and then, with the '''CTL key''' held down, '''left-clicking''' in the remaining desired '''swimlane level cells''' as shown here: | |
| − | + | <center>[[File:P70-0_4_1-(11E-1)-06102020.png]]</center> | |
| + | <!--<center>P70-0_4_1-(11E-1)-06102020.png</center>--> | ||
| − | + | You can only use the '''CTL+Left-Click '''option to make '''multiple swimlane''' selections at '''one swimlane level'''. That is, if you make your first selection at the '''Left#2 swimlane level''' in one of its '''swimlane level cells''' your next and following selections, if any, can only be in another '''Left#2 swimlane level cell'''. You are prohibited from making '''multiple swimlane''' selections across '''heterogeneous swimlane level cells''' with the '''CTL+Left-Click '''option. | |
| − | + | ====The SHIFT+Left-Click Option==== | |
| − | + | The '''SHIFT+Left-Click''' option is used to select a '''contiguous sequence of swimlane level cells''' and their '''swimlanes''' by first '''left-clicking''' in the first '''swimlane level cell''', then holding the '''SHIFT key '''down and , second, '''left-clicking''' in the last '''swimlane level cell''' in the sequence as shown below: | |
| − | + | <center>[[File:P70-0_4_1-(11F-1)-06102020.png]]</center> | |
| + | <!--<center>P70-0_4_1-(11F-1)-06102020.png</center>--> | ||
| − | + | As with the '''CTL+Left-Click '''option, you can only make sequential '''swimlane level cell '''selections in one '''swimlane level'''. | |
| − | + | ||
| − | === | + | ===Selection Methods Available for Multiple Text Columns=== |
| − | + | The selection methods available for '''rows''' and '''text column cells''' are essential the same as for selecting '''swimlanes''', '''swimlane level heading cells''' and '''swimlane level cells''' discussed in the previous sub-section. For selecting a '''row''', there must be at least one '''text column showing''' in the chart. This is the place where you can apply the '''left-click''' or '''slow left-click '''technique as shown here: | |
| − | <center>[[File:P70- | + | <center>[[File:P70-0_4_1-(11G-1)-06102020.png]]</center> |
| − | <!--<center>P70- | + | <!--<center>P70-0_4_1-(11G-1)-06102020.png</center>--> |
| − | + | When there are two or more '''text columns''' present in the chart, performing the single '''left-click '''in any '''text column cell '''in the '''row''' selects all '''text column cells and the row'''. To select a particular '''text column cell''', place the mouse cursor '''in that cell''' and use the '''slow left-click''' technique that selects all '''text column cells and the row''' and with the second '''left-click''' the specific '''text column cell''' as demonstrated in the previous sub-section. | |
| + | Remember that once you use the '''slow left-click''' the mouse '''left-click selection mode '''changes and to return to the normal '''left-click '''mode you must perform a '''single left click''' in '''empty space''' (any '''row''' in the '''graph''') to restore the normal selection mode. | ||
| − | The ''' | + | The '''CTL+Left-Click '''option can be used on any individual '''text column cell''' to select visible '''text column cells''' and their respective '''rows''' as shown below: |
| − | + | <center>[[File:P70-0_4_1-(11H-1)-06102020.png]]</center> | |
| + | <!--<center>P70-0_4_1-(11H-1)-06102020.png</center>--> | ||
| − | The ''' | + | The '''CTL+Left-Click '''option cannot be used to select '''text column cells '''and '''swimlane level cells'''. |
| − | + | The '''SHIFT+Left-Click''' option can be used, again as described in the previous sub-section, on a set of '''text column cells''' as shown below: | |
| − | + | <center>[[File:P70-0_4_1-(11I-1)-06102020.png]]</center> | |
| + | <!--<center>P70-0_4_1-(11I-1)-06102020.png</center>--> | ||
| − | + | When there is more than one set of '''text column cells '''in the chart, using this option works when any of the visible '''text column cells''' are clicked with the '''SHIFT+Left-Click''' technique. The '''SHIFT+Left-Click''' option cannot be used to select a series of '''text column cells''' and '''swimlane level cells'''. Attempting to do so changes the operation from a '''SHIFT+Left-Click on text column cells''' to a '''SHIFT+Left-Click on swimlane level cells'''. | |
| − | + | ||
| − | === | + | ===Editing Methods for Swimlane Levels and Text Column Components (Headings, Cells, Swimlanes, and Rows)=== |
| − | + | Once selection of a '''swimlane level cell '''or '''text column cell''' is accomplished, you have the option to access its right-click '''context menus''' or to use the '''grab boxes''' on '''row''' or '''swimlane''' components to change their '''height'''. This section’s focus is on the '''right-click context menus''' available although we don’t go into each individual command because these commands are the same as in previous versions of OnePager Pro and Express. New commands are present in OnePager 7.0 to support the '''Smart Text Optimization '''feature. | |
| − | + | For more information on the '''Smart Text Optimization''' feature and other '''label/text editing''' subjects, please see the articles at: [[Manual Editing Task/Milestone Shapes and Text Labels for Version 7.0 (Portal) | Manual Editing Task/Milestone Shapes and Text Labels (Portal)]] <!--9.0.1-70--> | |
| − | + | However, the inclusion of the '''multiple swimlane levels''' adds depth to what these commands can accomplish. | |
| − | + | ====Right-Clicking on Swimlane Level and Text Column Headings to Accesses the Edit Corner Properties Form==== | |
| − | + | The '''headings''' for '''swimlane levels''' are found in '''The Corner''' and right-clicking '''The Corner''' in any of its '''cells''' accesses the '''Edit corner properties''' form as shown here: | |
| − | <center>[[File:P70- | + | <center>[[File:P70-0_4_1-70-(12)-04242020.png]]</center> |
| − | <!--<center>P70- | + | <!--<center>P70-0_4_1-70-(12)-04242020.png</center>--> |
| − | + | Right-clicking in a '''text column heading''' also access the '''Edit corner properties''' form for the selected '''text column heading'''. Since '''The Corner''' is also used to display '''headings''' for '''time axis levels''' and '''right-clicking''' in these '''time axis level label cells''' also access the '''Edit corner properties''' form. | |
| − | ==== | + | ====Swimlane Level Cell Right-Click Context Menu==== |
| − | + | Right-clicking in a '''swimlane level cell''', regardless of whether it was pre-selected, accesses the '''swimlane level cell '''right-click '''context menu''' shown below: | |
| − | <center>[[File:P70- | + | <center>[[File:P70-0_4_1-70-(12A-1)-04242020.png]]</center> |
| − | <!--<center>P70- | + | <!--<center>P70-0_4_1-70-(12A-1)-04242020.png</center>--> |
| − | + | '''Right-clicking''' in any '''swimlane level cell''' to access the '''right-click''' '''context menu''' selects the '''entire swimlane''' associated with the '''swimlane level cell''' identified with the '''right-click'''. Generally, the actions that can be taken with the commands shown above apply to the '''swimlane level cell''' where the '''right-click''' was performed to access the '''context menu'''. However, some care should be exercised in the '''multiple swimlane level''' environments when using the '''swimlane level cell '''right-click '''context menu '''commands on '''swimlane level cells''' that have member '''swimlane level cells''' at a '''lower level'''. In particular the '''Add swimlane''' ('''Above''' or '''Below) '''can impact '''swimlane level cells''' at '''lower levels''' and the '''Add row to swimlane '''('''At top of swimlane''' and '''At bottom of swimlane''') should also be used with care. Please note, the '''Merge swimlanes ''' command requires that two or more '''swimlane level cells''' are selected for the command is '''enabled'''. Additionally, attention should be paid when '''editing '''multiple '''swimlane level cells''' selected using the '''CTL+Left-Click''' and the '''SHIFT+Left-Click'''. Once multiple '''swimlane level cells''' are selected and the '''swimlane level cell''' right-click '''context menu''' is accessed, any '''context menu''' command click is applied to all selected '''swimlane level cells'''. | |
| − | The ''' | + | The '''context menu’s''' '''Properties …''' command accesses the new '''Swimlane/Cells Properties''' form shown below with its two tabs: |
| − | + | <center>[[File:P70-0_4_1-70-(13)-03122020.png]]</center> | |
| + | <!--<center>P70-0_4_1-70-(13)-03122020.png</center>--> | ||
| − | + | :1) The '''Swimlane '''tab in the above form has controls for '''editing''' the '''swimlane borders''' and setting the '''Swimlane Background Color''' using the OnePager standard '''Color Chooser '''form. | |
| − | + | :2) The '''Cell''' tab in the form focuses on the '''swimlane level cell '''itself and the '''text string''' that is contained in the selected '''swimlane level cell'''. The '''Cell '''tab of the '''Swimlane/Cell Properties''' form is shown here: | |
| − | + | ||
| − | + | <center>[[File:P70-0_4_1-70-(14)-04242020.png]]</center> | |
| + | <!--<center>P70-0_4_1-70-(14)-04242020.png</center>--> | ||
| − | + | :3) As with the '''Swimlanes '''tab, the '''Cell '''tab has a '''Use Default Cell Properties''' button that resets the selected '''swimlane level cell’s properties '''back to the property settings in the '''Chart Properties''' form. | |
| − | + | <center>[[File:P70-0_4_1-70-(15)-04242020.png]]</center> | |
| + | <!--<center>P70-0_4_1-70-(15)-04242020.png</center>--> | ||
| − | + | :4) There are also '''Use Default Swimlane/Cell Properties '''buttons, shown above on both tabs, that '''resets''' the selected '''swimlane’s/cell's properties '''back to the property settings in the '''Chart Properties '''form. | |
| − | + | ||
| − | + | '''Caution''' should be exercised when '''editing multiple swimlane level cells''' selected using the '''CTL+Left-Click''' and the '''SHIFT+Left-Click''' using the '''Swimlane/Cell Properties '''form. | |
| − | + | :1) When '''multiple swimlane level cells''' are selected and the '''Swimlane/Cell Properties '''form accessed at the '''Swimlane '''tab, the '''last selected swimlane level cell’s properties '''appear in the tab. | |
| − | + | :2) Making any '''edit''' in '''Swimlane''' tab changes the '''properties''' of '''all selected swimlanes''' and this might not be the desired outcome. | |
| − | + | :3) For example, an '''edit '''to any '''Swimlane border property''' applies the '''edit '''to all selected '''swimlane borders'''. | |
| − | + | ||
| − | + | :4) Similar results are applied when '''multiple swimlane level cells''' are selected and the '''Swimlane/Cell Properties '''form is accessed at the '''Cell '''tab. | |
| − | + | :5) Any '''edit '''made to any '''property '''available in the tab is applied to '''all selected swimlane level cells'''. | |
| − | + | ====Text Column Cell Right-Click Context Menu==== | |
| − | + | '''Right-clicking''' in a '''text column cell''', regardless of whether it was pre-selected, accesses the '''text column cell '''right-click '''context menu'''. As mentioned above, this action selects all '''text column cells shown''' in the '''row '''and the '''row '''itself and accesses the '''text column cell '''right-click '''context menu''' shown below: | |
| − | [[ | + | <center>[[File:P70-0_4_1-70-(16-1)-04242020.png]]</center> |
| + | <!--<center>P70-0_4_1-70-(16-1)-04242020.png</center>--> | ||
| − | + | Generally, the actions that can be taken with the commands shown above apply to the '''text column cell''' where the '''right-click''' was performed to access the '''context menu'''. However, some care should be exercised when using the two '''swimlane related '''commands in this '''context menu''' (e.g., '''Split swimlanes''' and '''Group rows into a swimlane''') where there are '''multiple swimlane levels''' present to the left of the selected '''text column.''' | |
| − | + | The '''Row height … '''command accesses the '''Row height''' form shown below: | |
| − | ( | + | <center>[[File:P70-0_4_1-70-(17)-04242020.png]]</center> |
| + | <!--<center>P70-0_4_1-70-(17)-04242020.png</center>--> | ||
| + | |||
| + | The '''context menu’s''' '''Properties …''' command accesses the new '''Row/Column Properties''' form shown below with its two tabs: | ||
| + | |||
| + | <center>[[File:P70-0_4_1-70-(18)-04242020.png]]</center> | ||
| + | <!--<center>P70-0_4_1-70-(18)-04242020.png</center>--> | ||
| + | |||
| + | :1) The '''Row '''tab in the above form has controls for '''editing''' the '''row borders''' and setting the '''Row Background Color''' using the OnePager standard '''Color Chooser '''form. | ||
| + | |||
| + | :2) The '''Cell''' tab in the form focuses on the '''text column cell '''itself and the '''text string''' that is contained in the selected '''text column cell''' as shown here: | ||
| + | |||
| + | <center>[[File:P70-0_4_1-70-(19)-04242020.png]]</center> | ||
| + | <!--<center>P70-0_4_1-70-(19)-04242020.png</center>--> | ||
| + | |||
| + | :3) There are also '''Use Default Row/Column Properties '''buttons, shown above on both tabs, that '''resets''' the selected '''row’s/column's properties '''back to the property settings in the '''Chart Properties '''form. | ||
| + | |||
| + | '''Caution''' should be exercised when '''editing multiple text column cells''' selected using the '''CTL+Left-Click''' and the '''SHIFT+Left-Click''' using the '''Row/Column Properties '''form. | ||
| + | |||
| + | :1) When '''multiple text column cells''' are selected and the '''Row/Column Properties '''form accessed at the '''Swimlane '''tab, the last selected '''text column cell’s properties '''appear in the tab. | ||
| + | |||
| + | :2) Making any '''edit''' in '''Row''' tab changes the '''properties''' of all selected '''rows''' and this might not be the desired outcome. For example, an '''edit '''to any '''Row border property''' applies the '''edit '''to all selected '''row borders'''. | ||
| + | |||
| + | :3) Similar results are applied when '''multiple text columns cells''' are selected and the '''Row/Column Properties '''form is accessed at the '''Cell '''tab. Any '''edit '''made to any '''property '''available in the tab is applied to all selected '''text column cells'''. | ||
| + | |||
| + | ====Empty Space Right-Clicking Context Menu==== | ||
| + | |||
| + | Performing a right-click in the '''graph''' (defined as the area to the right of '''swimlane level cells and text column cells''', below the '''time axis''', and above the '''footers''') accesses the '''empty space''' right-click '''context menu''' shown below: | ||
| + | |||
| + | <center>[[File:P70-0_4_1-70-(20)-04242020.png]]</center> | ||
| + | <!--<center>P70-0_4_1-70-(20)-04242020.png</center>--> | ||
| + | |||
| + | The '''empty space '''right-click '''context menu''' contains the same set of commands as provided in previous versions of OnePager Pro and Express. However, the commands related to '''swimlanes '''require some care in their use when the chart is showing '''multiple swimlane levels'''. | ||
| + | |||
| + | Where you make the right-click in the '''graph '''determines where the '''Row '''or '''Swimlane''' related commands are applied. | ||
| + | |||
| + | :1) Specifically, these commands are: (1) '''Hide swimlane''', (2) '''Hide row''', (3) '''Add swimlane''', (4) '''Add row''', (5) '''Insert Floating time axis level''', and (6) '''Row height …''' | ||
| + | |||
| + | :2) Three commands shown above have '''sub-context menus''' with commands that must be selected before the command can be applied to the '''graph'''. | ||
| + | |||
| + | :3) Specifically, these commands are: (1) '''Add swimlane''', (2) ''' Add row''', (3) '''Insert floating time axis '''level, and (4) '''Copy to clipboard. | ||
| + | |||
| + | :4) The '''Insert floating time axis level''' command operates the same as the '''Add row '''command but the '''sub-context menu''' deals with which '''time axis level '''to '''insert'''. | ||
| + | |||
| + | As with the '''text column '''right-click '''context menu''', the '''Row height … '''command accesses the '''Row height''' form. The '''Chart Properties '''command accesses the '''Chart Properties '''form at the '''Rows/Swimlanes '''tab so that you can make '''global edits '''to '''row and swimlane components''' as shown below: | ||
| + | |||
| + | <center>[[File:P70-0_4_1-70-(21)-04242020.png]]</center> | ||
| + | <!--<center>P70-0_4_1-70-(21)-04242020.png</center>--> | ||
| + | |||
| + | ==Related Links== | ||
| + | |||
| + | [[Using Rows and Swimlanes for OnePager Version 7.0 | Using Rows and Swimlanes]] <!--4.0.1.5-70--> | ||
| + | |||
| + | [[Basic Workflows for Version 7.0 (Portal) | Basic Workflows (Portal)]] <!--7.0.1-70--> | ||
| + | |||
| + | [[Manual Editing Task/Milestone Shapes and Text Labels for Version 7.0 (Portal) | Manual Editing Task/Milestone Shapes and Text Labels (Portal)]] <!--9.0.1-70--> | ||
| + | |||
| + | [[Creating and Editing Rows and Swimlanes for Version 7.0 (Portal) | Creating and Editing Rows and Swimlanes (Portal)]] <!--12.0.1-70--> | ||
| + | |||
| + | (12.0.2-70) | ||
[[Category:Version 7.0]] | [[Category:Version 7.0]] | ||
| − | [[Category: | + | [[Category:Multiple Swimlane Levels]] |
| − | [[Category: | + | [[Category:Name Label Collision Avoidance]] |
[[Category:Ribbon]] | [[Category:Ribbon]] | ||
| − | |||
[[Category:Charts]] | [[Category:Charts]] | ||
| + | [[Category:Snapshots]] | ||
| + | [[Category:Chart Properties Form]] | ||
| + | [[Category:Editing a Chart]] | ||
| + | [[Category:Templates]] | ||
[[Category:OnePager Pro]] | [[Category:OnePager Pro]] | ||
[[Category:OnePager Express]] | [[Category:OnePager Express]] | ||
Revision as of 15:35, 14 January 2021
Contents
- 1 About Multiple Swimlane Levels
- 2 Multiple Swimlane Levels - Example
- 3 Manual Editing With Multiple Swimlane Levels - Example
- 4 Related Links
About Multiple Swimlane Levels
OnePager version 7.0 features a dramatic increase in visual capability by providing you the ability to display up to three (3) swimlane levels in your charts. Previous versions of OnePager Pro and Express featured only one swimlane level with multiple rows grouped within this one swimlane level.
Multiple Swimlane Levels - Example
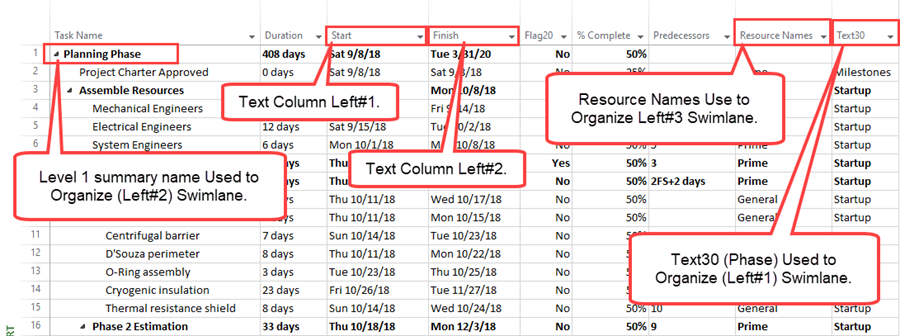
Perhaps the best way to familiarize you with this new capability is to provide an example of how multiple swimlane levels can be used to organize your chart. Using the BlueGrass Project’s Microsoft Project source plan shown below, we can create a chart with three swimlane levels:
Getting Started
Before jumping into the example, perhaps some terminology should be explained from the chart above.
The illustration above is our BlueGrass Project Plan with standard Microsoft Project fields with names that are typically used. However, in the example we are going to construct the multiple swimlane level chart with three swimlane levels and two text columns as follows:
- 1) The Text30 MS Project source plan field is used to represent the highest swimlane level called Left#1, as you’ll see in the Chart Properties form. This swimlane level represents the Phases of the project.
- 2) As shown in the above illustration, the Level 1 summary name component of the MS Project source plan is the next highest swimlane level called Left#2.
- 3) For the lowest swimlane level shown in the chart or Left#3, we use the Resource Names field from the MS Project source plan.
- 4) Additionally, the chart with multiple swimlane levels uses the Start and Finish fields form the MS Project source plans to display two text columns in the chart called Left#1 and Left#2, respectively.
If you are not using one of OnePager Pro’s standard Template Properties forms, these settings must be updated into the Chart Properties form after the basic chart is created. However, what is done here in the interest of speeding this example along is to create a Template Properties form specifically for this chart and establish the settings within this Template Properties form as described above. As part of the creation of this Template Properties form, we show the contents of the Swimlane and Text Column Formatting forms to demonstrate where swimlane level headings and text column headings are established for the chart.
Setting Up the Template Properties Form
Showing the Left#1 Swimlane Level
The next series of illustrations display the Template Properties form’s Rows/Swimlanes tab at the three swimlane levels (Left#1 through Left#3) and the two Text Column sub-tabs for Left#1 and Left#2.
The illustration below shows the Template Properties form’s Rows/Swimlanes tab and the Left#1 swimlane level sub-tab along with the Swimlane Formatting – Left#1 form which was accessed by clicking the Swimlane Formatting … button shown below:
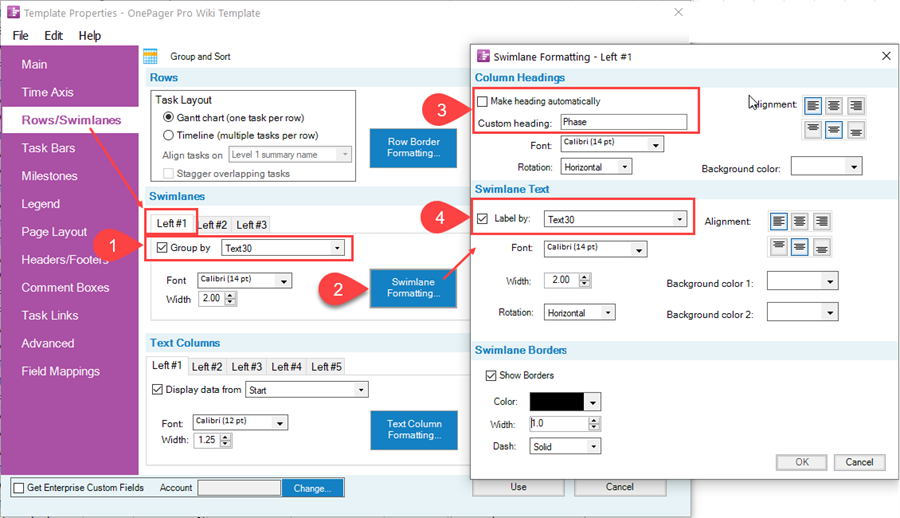
- 1) At Step 1 shown above, the Left#1 sub-tab of the tab in the Swimlanes control group shows that the Group by checkbox is checked ON and the dropdown list of MS Project source plan field names were used to select the Text30 MS Project source plan field to group rows into this swimlane level.
- 2) Step 2 shows that the Swimlane Formatting… button was clicked to access the Swimlane Formatting form for Left#1; the name of the form being expanded so it is clear which swimlane level is the focus.
- 3) Step 3 shows that the Make heading automatically checkbox is checked OFF, enabling the Custom heading: window where we’ve typed in the term Phrase which appears in The Corner of the chart on top of the Left#1 swimlane level column.
- 4) Step 4 has the Label by: checkbox checked ON which is the show/no show switch for this swimlane level. Normally, the enabled window displays the source plan field that is used to populate the swimlane level and its cells. You do have the option to change this selection to another source plan field if necessary by using the dropdown list.
- 5) Note that the Swimlane Formatting – Left#1 form provides controls for managing the label/text for the Column Heading, Swimlane Text in each of the swimlane level cells, and controls for managing Swimlane Borders.
- 6) After completing the settings for the Swimlane Formatting – Left#1 form, click the OK button at the bottom of the form to return to the Rows/Swimlanes tab where you can continue editing.
Showing the Left#2 Swimlane Level
Continuing with the definition of swimlane levels process, the illustration below shows the Template Properties form’s Rows/Swimlanes tab and the Left#2 swimlane level sub-tab along with the Swimlane Formatting – Left#2 form which was accessed by clicking the Swimlane Formatting … button shown below:
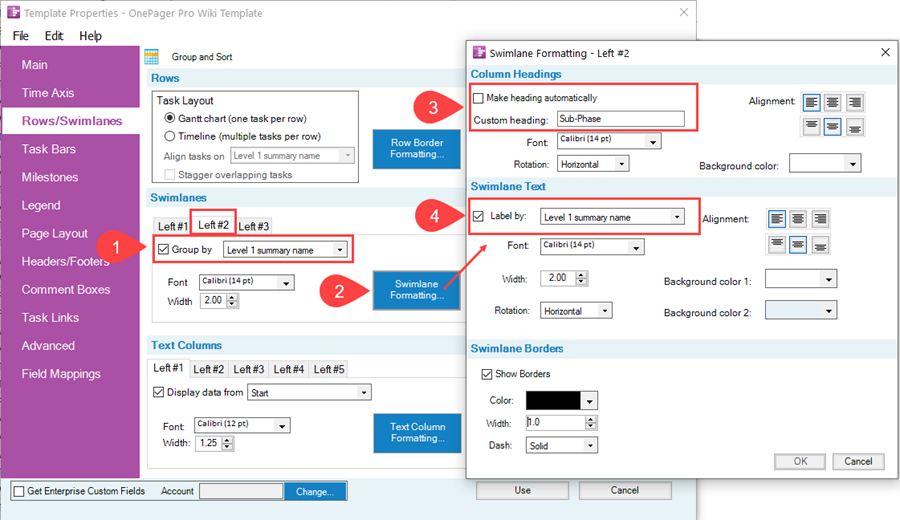
- 1) The illustration above parallels the previous illustration for the Left#1 swimlane level where the Group by checkbox is checked ON, the Left#2 swimlane level the Group by field is Level 1 summary name, and in the Swimlane Formatting – Left#2 form we are using the term Sub-Phase as to the swimlane level heading for the Left#2 swimlane level.
- 2) The contents of the Swimlane Formatting – Left#2 form are identical for each swimlane level.
- 3) After completing the settings for the Swimlane Formatting – Left#2 form, click the OK button at the bottom of the form to return to the Rows/Swimlanes tab where you can continue editing.
Showing the Left#3 Swimlane Level
To complete the definition of the three swimlane levels, click the Lef#3 sub-tab in the Swimlanes control group of the Rows/Swimlanes tab as shown below:
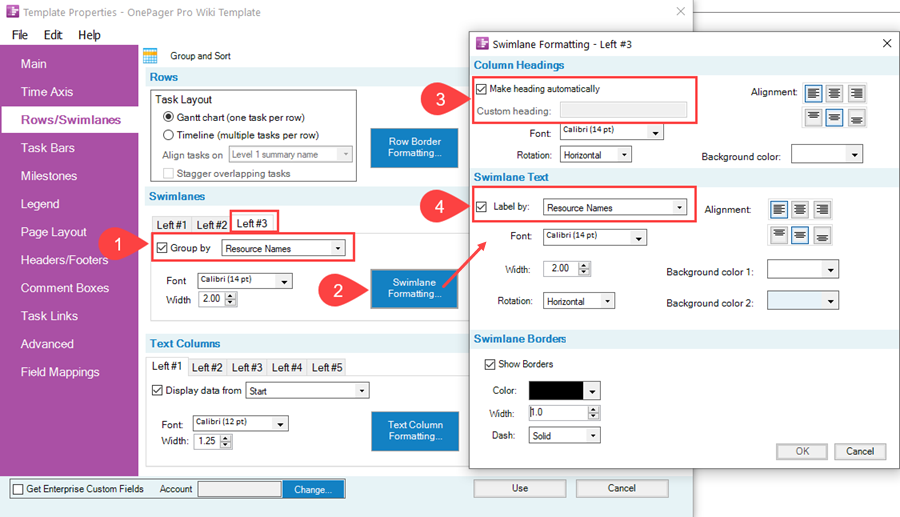
- 1) Clicking the Left#3 sub-tab shown in Step 1 above, the Group by checkbox is checked ON and the Resource Names MS Project source plan field is selected for the Left#3 swimlane level.
- 2) After clicking the Swimlane Formatting… button shown at Step 2 and accessing the Swimlane Formatting – Left#3 form, note that the Make heading automatically checkbox is checked ON. This action disables the Custom heading: window and tells OnePager to use Resource Names for swimlane level heading for Left#3.
- 3) After completing the Swimlane Formatting – Left#3 form, click the OK button to return to the Rows/Swimlanes tab.
This completes the definition of the three swimlane levels for this Template Properties form and we can move to the Text Columns control group on the Rows/Swimlanes tab to define the two text columns for this series of charts as described below.
Showing the Left#1 Text Column
Setting up the definition for text columns has not changed from previous versions of OnePager. However, the controls are reorganized and, like the swimlane level definition, a Text-Column Formatting – Left#n form is provided for each of the five (5) text columns you can define for a chart as shown below for text column Left#1:
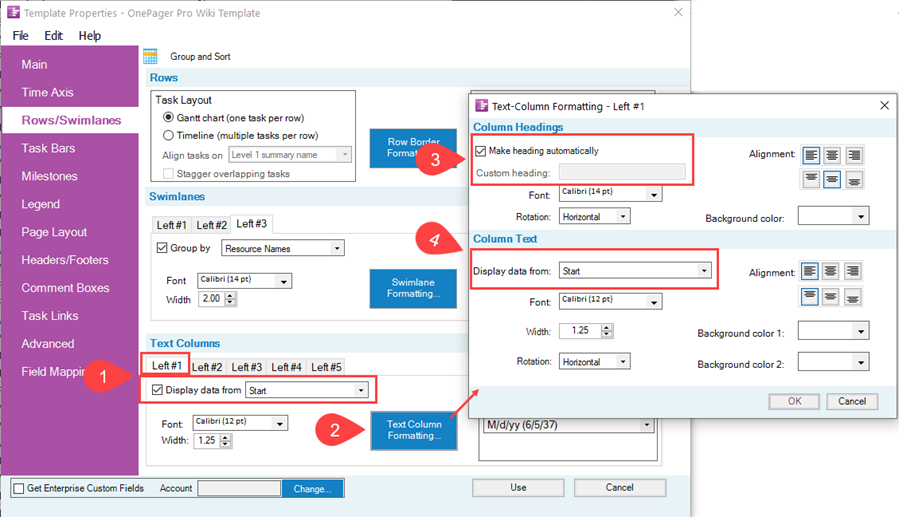
- 1) In Step 1 above, the Left#1 text column sub-tab is selected and the Display data from checkbox is checked ON and used with the adjoining dropdown menu to select the MS Project Start source plan field for this text column.
- 2) In Step 2, the action is to click the Text Column Formatting… button to access the Text-Column Formatting – Left#1 form.
- 3) In Step 3, we’ve let OnePager create the text column Left#1 heading by making sure the Make heading automatically checkbox is checked ON.
- 4) Again, as an option, Step 4 shows that in the Text-Column Formatting – Left#1 form you can use the Display data from dropdown menu in the Column Text control group to change the source plan field.
- 5) When finished with the Text-Column Formatting – Left#1 form, click the OK button to return to the Rows/Swimlanes tab.
Showing the Left#2 Text Column
We finish up our example with the definition of Text Column Left#2 as shown in the Rows/Swimlanes form at the Left#2 sub-tab in the Text Columns control group shown below:
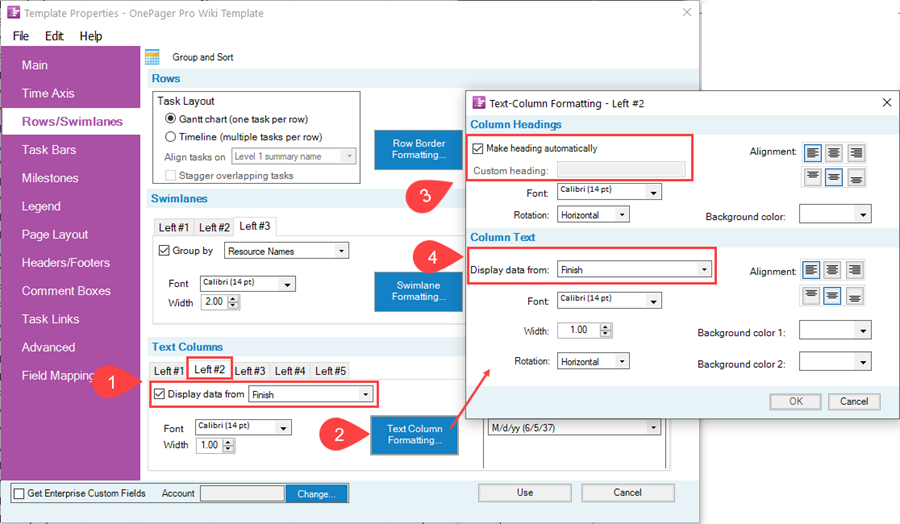
- 1) Looking at the Left#2 sub-tab in the Text Columns control group of the Rows/Swimlanes tab in Step 1, the Display data from checkbox is checked ON and the dropdown window shows that the MS Project source plan Finish field is selected.
- 2) For Step 2, clicking the Text Column Formatting… button to access the Text-Column Formatting – Left#2 form shows that the Make headings automatically checkbox is checked ON so OnePager creates the text column heading for Left#2.
- 3) In Step 3, the Finish source plan field is displayed in the form’s Column Text control group and the window is available to access the dropdown menu to change the selection.
- 4) When finished with the Text-Column Formatting – Left#2 form, click the OK button to return to the Rows/Swimlanes tab.
This completes the settings for swimlane levels and text columns in this Template Properties form. Once finished, click the Use button and the Template Properties form becomes the current Template Properties for the creation of chart.
Creating the Chart
Creating the chart after the Template Properties form is configured, made the current Template Properties form, and the MS Project source plan identified, it is a matter of using one of the OnePager Pro or Express basic workflows to create the chart.
For more information on Basic Workflows, please see the articles at: Basic Workflows (Portal)
We’ve gone through that process with the current Template Properties form and used the BlueGrass Project source plan to create a chart that looks like this:
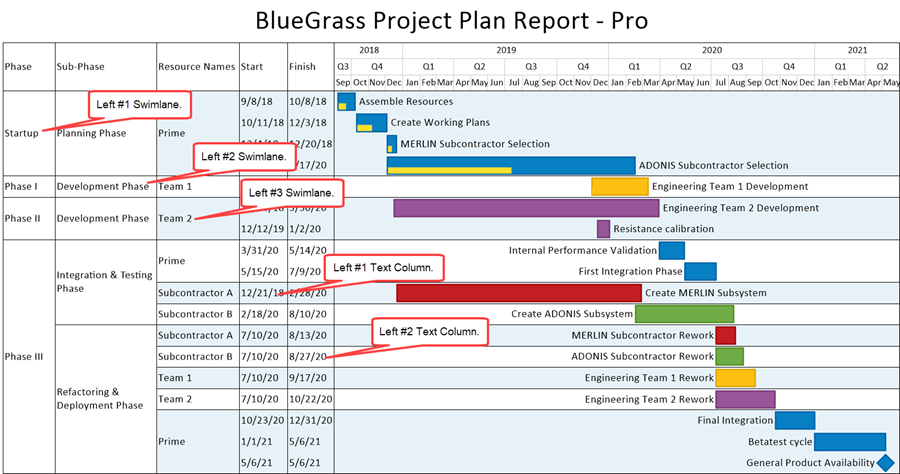
In the chart above, the swimlane levels, the swimlane level headings, the swimlane level cells, the text column headings, and the text column cells all correspond to the definitions in the Template Properties form we updated. There is a lot of information in the chart above with respect to swimlane levels and the graph is organized such that task bars are presented as descending from left to right by Start Date.
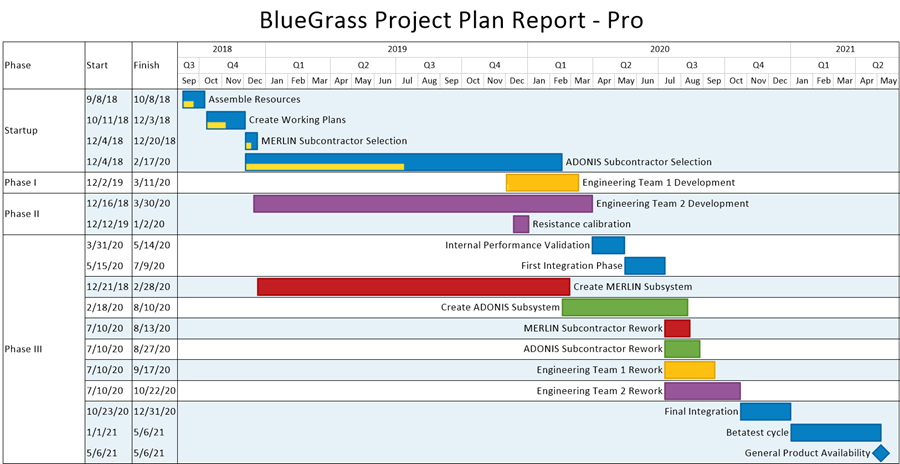
If we assume for a moment that senior executives are interested in the entire project but at the Phase level, the chart above can be configured into a single swimlane level chart just displaying the Left#1 swimlane level by going to the Chart Properties form’s Rows/Swimlanes tab and turning OFF the Label by checkbox in the corresponding Swimlane Formatting – Left#2 and Swimlane Formatting – Left#3 forms as shown for the Left#3 swimlane level below:
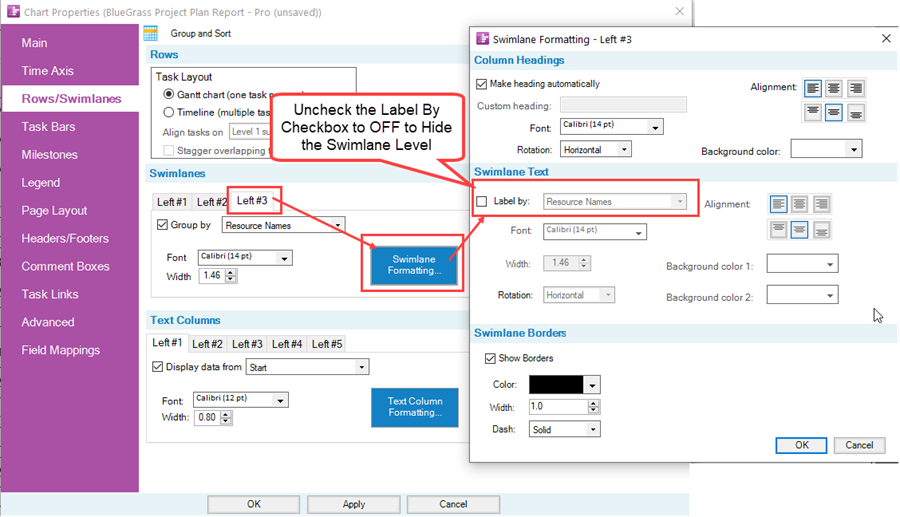
When these two Chart Properties form changes are made, the chart looks like this:
In a similar way the swimlane levels defined for this chart can be reconfigured to focus the content on middle management that might be more interested in the Sub-Phases and Resource Names. By checking the Label by checkboxes to ON in the Swimlane Formatting – Left#2 and Left#3 forms and unchecking the Label by checkbox for the Swimlane Formatting –Left #1 form OFF the chart looks like the one below:
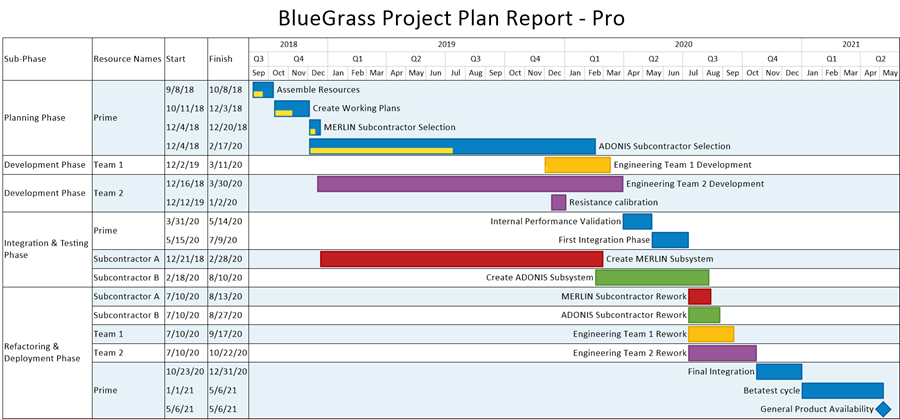
In the above chart, middle managers can see the Sub-Phase organization and the Resource Names assigned without the need to have the Phase swimlane level in view. Throughout these simple modifications of the chart, the organization of the row and task bars remained the same.
Manual Editing With Multiple Swimlane Levels - Example
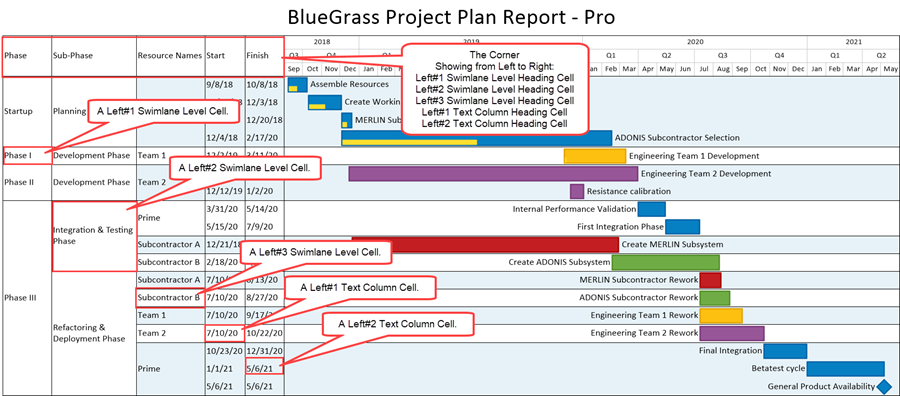
The example above showed how editing within the Template Properties and Chart Properties forms can globally edit the chart. In this section we’ll cover the methods for selecting and editing both swimlane level and text column level components (i.e., headings, cells, swimlanes, and rows). You can select and edit individual swimlane level heading cells and text column heading cells in The Corner as well as individual swimlane level cells where these terms are defined in the chart shown below:
Selection Methods Available for Multiple Swimlane Levels
Before discussing the available features for individually editing swimlane level cells and swimlane properties, text columns and their properties, we need to emphasize that the selection methods available from previous versions of OnePager Pro and Express are the same with OnePager version 7.0.
The Single Left-Click Option
This means that you retain the capability to use the left-click in a swimlane level heading cell, a swimlane, a text column heading cell, and a text column cell and its row to individually select these elements in the chart and graph. Selecting a row requires that at least one text column be showing in the chart so that the left-click to select a row has a position where the row can be selected. Performing a left-click in empty space in the graph is not supported in OnePager version 7.0. Left-clicking in swimlane and text column cells is primarily done to select swimlane and rows for dragging and dropping actions to reorganize them in the chart. Left-clicking in these components is also a way of selecting before using the right-click to access the component’s right-click context menu. The right-click and context menu discussions are presented in a later section.
The Slow Left-Click Option
The slow left-click is a technique available in OnePager version 7.0 for distinguishing between the intent to select an entire swimlane, for example at any level, and selecting a particular swimlane level cell. When the slow left-click technique is used on swimlane level cell, the first left-click in a swimlane level cell selects the swimlane level cell and its swimlane in accordance with the swimlane level being selected as shown here:

The second left-click part of the slow left-click technique results in the swimlane level cell being selected as shown below:

When the slow left-click technique is used with text columns, the first left-click in a text column cell selects the text column cell and its row as shown here:

The second left-click part of the slow left-click technique results in just the text column cell being selected as shown below:

With text columns, doing a left-click in one text column cell when more than one text column is showing selects all text column cells in the row. To use the slow double-left-click effectively, perform the first left-click in the text column cell you wish to ultimately select. Once you make an individual swimlane level cell or text column cell selection with this option, OnePager remains in the slow left- click mode and you cannot select an entire swimlane or text column’s row. To exit the slow left-click mode, perform one left-click in empty space in the graph. The right-click selection methods and discussed in a later sub-section below.
The CTL+Left-Click Option
The CTL+Left-Click option is used to select multiple individual swimlanes by first selecting the first swimlane with a left-click in the desired swimlane level cell and then, with the CTL key held down, left-clicking in the remaining desired swimlane level cells as shown here:

You can only use the CTL+Left-Click option to make multiple swimlane selections at one swimlane level. That is, if you make your first selection at the Left#2 swimlane level in one of its swimlane level cells your next and following selections, if any, can only be in another Left#2 swimlane level cell. You are prohibited from making multiple swimlane selections across heterogeneous swimlane level cells with the CTL+Left-Click option.
The SHIFT+Left-Click Option
The SHIFT+Left-Click option is used to select a contiguous sequence of swimlane level cells and their swimlanes by first left-clicking in the first swimlane level cell, then holding the SHIFT key down and , second, left-clicking in the last swimlane level cell in the sequence as shown below:
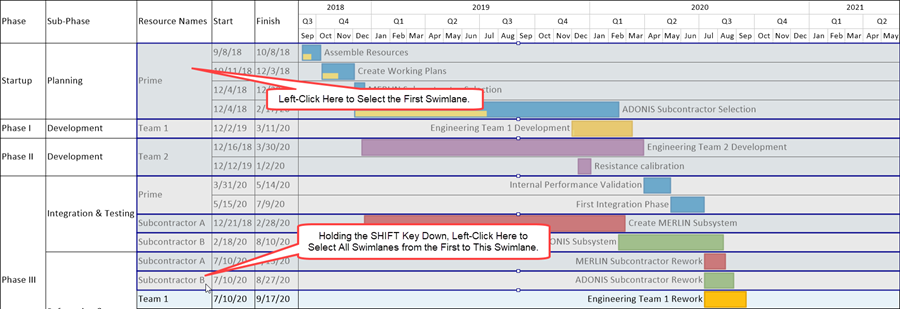
As with the CTL+Left-Click option, you can only make sequential swimlane level cell selections in one swimlane level.
Selection Methods Available for Multiple Text Columns
The selection methods available for rows and text column cells are essential the same as for selecting swimlanes, swimlane level heading cells and swimlane level cells discussed in the previous sub-section. For selecting a row, there must be at least one text column showing in the chart. This is the place where you can apply the left-click or slow left-click technique as shown here:

When there are two or more text columns present in the chart, performing the single left-click in any text column cell in the row selects all text column cells and the row. To select a particular text column cell, place the mouse cursor in that cell and use the slow left-click technique that selects all text column cells and the row and with the second left-click the specific text column cell as demonstrated in the previous sub-section. Remember that once you use the slow left-click the mouse left-click selection mode changes and to return to the normal left-click mode you must perform a single left click in empty space (any row in the graph) to restore the normal selection mode.
The CTL+Left-Click option can be used on any individual text column cell to select visible text column cells and their respective rows as shown below:

The CTL+Left-Click option cannot be used to select text column cells and swimlane level cells.
The SHIFT+Left-Click option can be used, again as described in the previous sub-section, on a set of text column cells as shown below:

When there is more than one set of text column cells in the chart, using this option works when any of the visible text column cells are clicked with the SHIFT+Left-Click technique. The SHIFT+Left-Click option cannot be used to select a series of text column cells and swimlane level cells. Attempting to do so changes the operation from a SHIFT+Left-Click on text column cells to a SHIFT+Left-Click on swimlane level cells.
Editing Methods for Swimlane Levels and Text Column Components (Headings, Cells, Swimlanes, and Rows)
Once selection of a swimlane level cell or text column cell is accomplished, you have the option to access its right-click context menus or to use the grab boxes on row or swimlane components to change their height. This section’s focus is on the right-click context menus available although we don’t go into each individual command because these commands are the same as in previous versions of OnePager Pro and Express. New commands are present in OnePager 7.0 to support the Smart Text Optimization feature.
For more information on the Smart Text Optimization feature and other label/text editing subjects, please see the articles at: Manual Editing Task/Milestone Shapes and Text Labels (Portal)
However, the inclusion of the multiple swimlane levels adds depth to what these commands can accomplish.
Right-Clicking on Swimlane Level and Text Column Headings to Accesses the Edit Corner Properties Form
The headings for swimlane levels are found in The Corner and right-clicking The Corner in any of its cells accesses the Edit corner properties form as shown here:

Right-clicking in a text column heading also access the Edit corner properties form for the selected text column heading. Since The Corner is also used to display headings for time axis levels and right-clicking in these time axis level label cells also access the Edit corner properties form.
Swimlane Level Cell Right-Click Context Menu
Right-clicking in a swimlane level cell, regardless of whether it was pre-selected, accesses the swimlane level cell right-click context menu shown below:

Right-clicking in any swimlane level cell to access the right-click context menu selects the entire swimlane associated with the swimlane level cell identified with the right-click. Generally, the actions that can be taken with the commands shown above apply to the swimlane level cell where the right-click was performed to access the context menu. However, some care should be exercised in the multiple swimlane level environments when using the swimlane level cell right-click context menu commands on swimlane level cells that have member swimlane level cells at a lower level. In particular the Add swimlane (Above or Below) can impact swimlane level cells at lower levels and the Add row to swimlane (At top of swimlane and At bottom of swimlane) should also be used with care. Please note, the Merge swimlanes command requires that two or more swimlane level cells are selected for the command is enabled. Additionally, attention should be paid when editing multiple swimlane level cells selected using the CTL+Left-Click and the SHIFT+Left-Click. Once multiple swimlane level cells are selected and the swimlane level cell right-click context menu is accessed, any context menu command click is applied to all selected swimlane level cells.
The context menu’s Properties … command accesses the new Swimlane/Cells Properties form shown below with its two tabs:
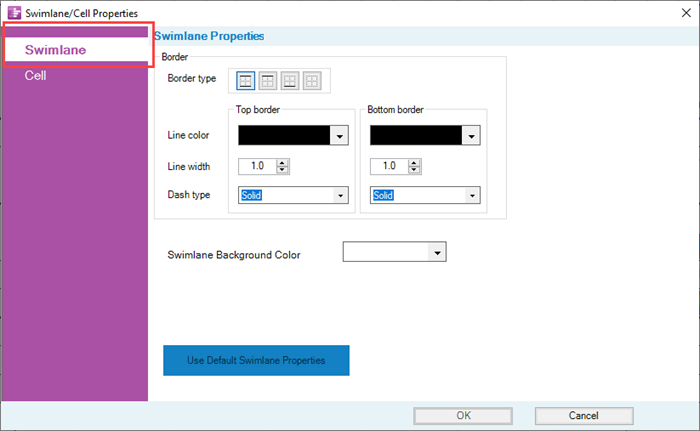
- 1) The Swimlane tab in the above form has controls for editing the swimlane borders and setting the Swimlane Background Color using the OnePager standard Color Chooser form.
- 2) The Cell tab in the form focuses on the swimlane level cell itself and the text string that is contained in the selected swimlane level cell. The Cell tab of the Swimlane/Cell Properties form is shown here:
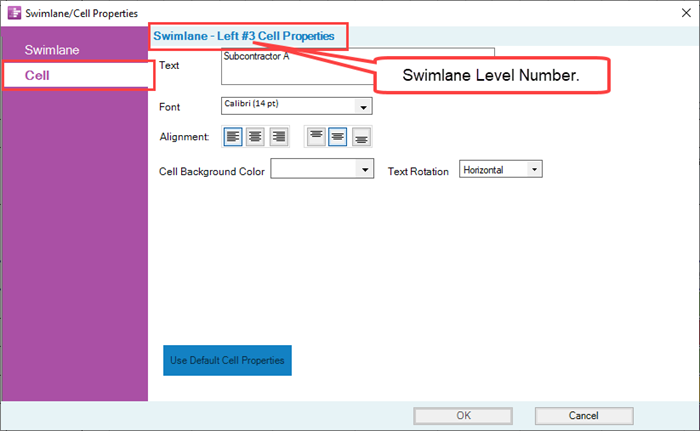
- 3) As with the Swimlanes tab, the Cell tab has a Use Default Cell Properties button that resets the selected swimlane level cell’s properties back to the property settings in the Chart Properties form.
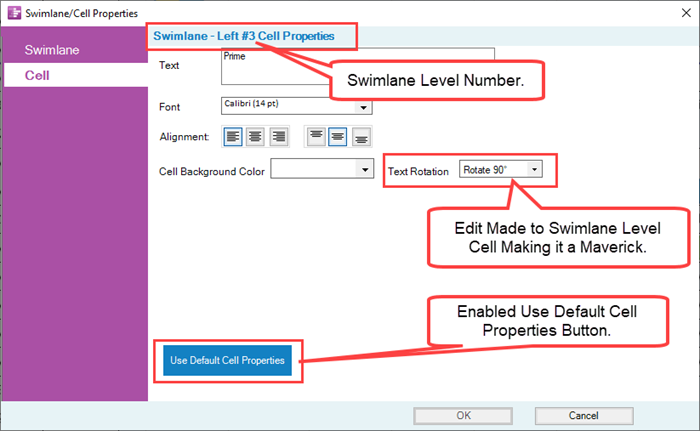
- 4) There are also Use Default Swimlane/Cell Properties buttons, shown above on both tabs, that resets the selected swimlane’s/cell's properties back to the property settings in the Chart Properties form.
Caution should be exercised when editing multiple swimlane level cells selected using the CTL+Left-Click and the SHIFT+Left-Click using the Swimlane/Cell Properties form.
- 1) When multiple swimlane level cells are selected and the Swimlane/Cell Properties form accessed at the Swimlane tab, the last selected swimlane level cell’s properties appear in the tab.
- 2) Making any edit in Swimlane tab changes the properties of all selected swimlanes and this might not be the desired outcome.
- 3) For example, an edit to any Swimlane border property applies the edit to all selected swimlane borders.
- 4) Similar results are applied when multiple swimlane level cells are selected and the Swimlane/Cell Properties form is accessed at the Cell tab.
- 5) Any edit made to any property available in the tab is applied to all selected swimlane level cells.
Text Column Cell Right-Click Context Menu
Right-clicking in a text column cell, regardless of whether it was pre-selected, accesses the text column cell right-click context menu. As mentioned above, this action selects all text column cells shown in the row and the row itself and accesses the text column cell right-click context menu shown below:

Generally, the actions that can be taken with the commands shown above apply to the text column cell where the right-click was performed to access the context menu. However, some care should be exercised when using the two swimlane related commands in this context menu (e.g., Split swimlanes and Group rows into a swimlane) where there are multiple swimlane levels present to the left of the selected text column.
The Row height … command accesses the Row height form shown below:
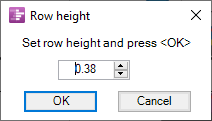
The context menu’s Properties … command accesses the new Row/Column Properties form shown below with its two tabs:
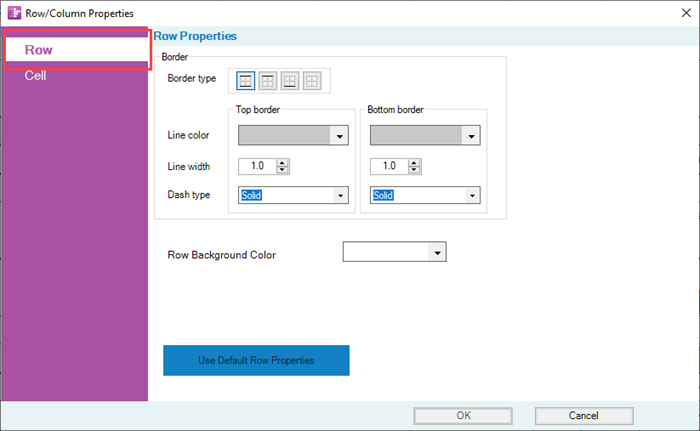
- 1) The Row tab in the above form has controls for editing the row borders and setting the Row Background Color using the OnePager standard Color Chooser form.
- 2) The Cell tab in the form focuses on the text column cell itself and the text string that is contained in the selected text column cell as shown here:
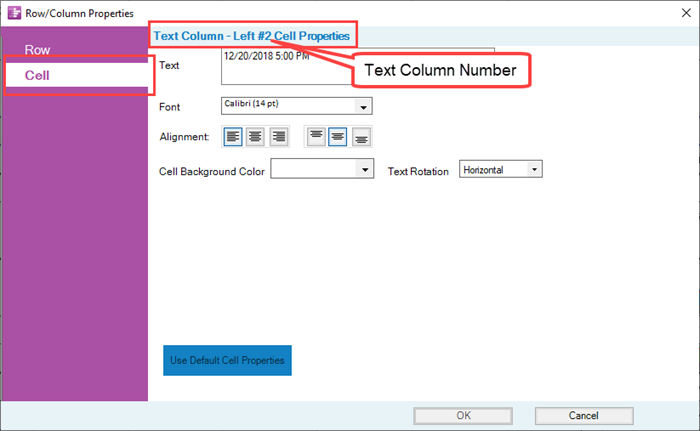
- 3) There are also Use Default Row/Column Properties buttons, shown above on both tabs, that resets the selected row’s/column's properties back to the property settings in the Chart Properties form.
Caution should be exercised when editing multiple text column cells selected using the CTL+Left-Click and the SHIFT+Left-Click using the Row/Column Properties form.
- 1) When multiple text column cells are selected and the Row/Column Properties form accessed at the Swimlane tab, the last selected text column cell’s properties appear in the tab.
- 2) Making any edit in Row tab changes the properties of all selected rows and this might not be the desired outcome. For example, an edit to any Row border property applies the edit to all selected row borders.
- 3) Similar results are applied when multiple text columns cells are selected and the Row/Column Properties form is accessed at the Cell tab. Any edit made to any property available in the tab is applied to all selected text column cells.
Empty Space Right-Clicking Context Menu
Performing a right-click in the graph (defined as the area to the right of swimlane level cells and text column cells, below the time axis, and above the footers) accesses the empty space right-click context menu shown below:
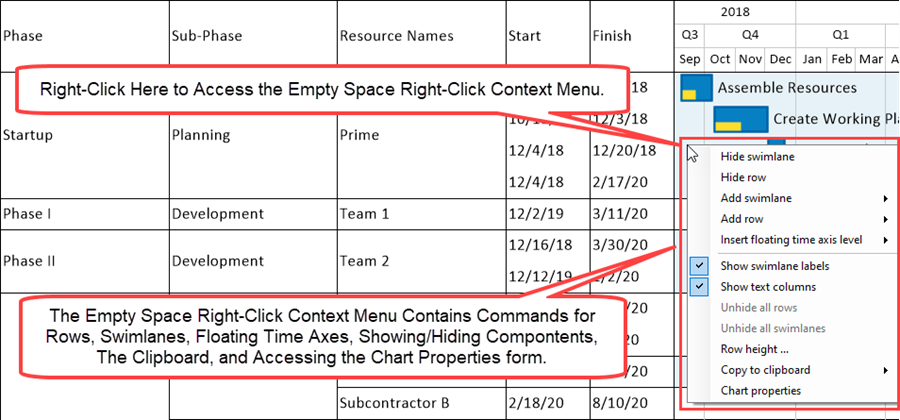
The empty space right-click context menu contains the same set of commands as provided in previous versions of OnePager Pro and Express. However, the commands related to swimlanes require some care in their use when the chart is showing multiple swimlane levels.
Where you make the right-click in the graph determines where the Row or Swimlane related commands are applied.
- 1) Specifically, these commands are: (1) Hide swimlane, (2) Hide row, (3) Add swimlane, (4) Add row, (5) Insert Floating time axis level, and (6) Row height …
- 2) Three commands shown above have sub-context menus with commands that must be selected before the command can be applied to the graph.
- 3) Specifically, these commands are: (1) Add swimlane, (2) Add row, (3) Insert floating time axis level, and (4) Copy to clipboard.
- 4) The Insert floating time axis level command operates the same as the Add row command but the sub-context menu deals with which time axis level to insert.
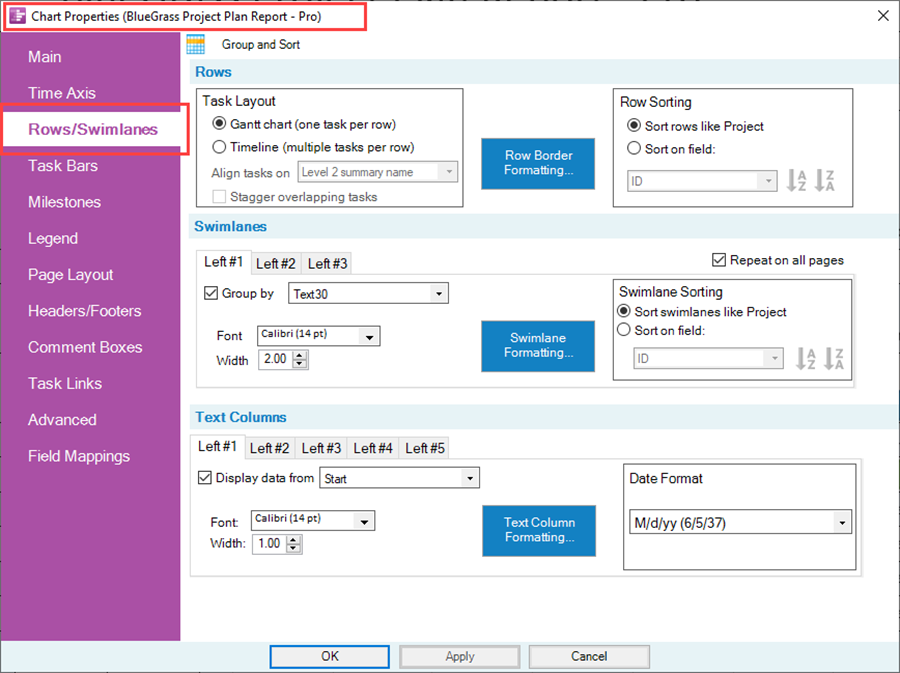
As with the text column right-click context menu, the Row height … command accesses the Row height form. The Chart Properties command accesses the Chart Properties form at the Rows/Swimlanes tab so that you can make global edits to row and swimlane components as shown below:
Related Links
Manual Editing Task/Milestone Shapes and Text Labels (Portal)
Creating and Editing Rows and Swimlanes (Portal)
(12.0.2-70)