Difference between revisions of "Testing Article1"
| Line 1: | Line 1: | ||
| − | ==About Moving | + | ==About Moving Swimlanes in the Chart== |
| − | + | As it is with '''rows''', for some schedule presentations the '''order of swimlanes''' in the chart done by OnePager may not be totally sufficient to meet your needs. '''Swimlanes''' can be manually '''moved up and down''' in the chart by selecting the appropriate '''swimlane level cell''' of the desired '''swimlane''' and, once selected, using the mouse '''drag and drop method''' on the selected '''swimlane''' to place it in the desired position. | |
| − | OnePager provides assistance by '''highlighting the selected | + | OnePager provides assistance by '''highlighting the selected swimlane''' first and as the selected '''swimlane''' is '''dragged up or down''' providing a '''red line with a pointer''' to tell you where the '''dragged swimlane''' is to be '''dropped (placed''' at the end of the operation. Finally, releasing the mouse left-click button causes OnePager to place the selected '''swimlane''' in the designed or '''dropped''' position. |
| − | You must have at least one ''' | + | You must have at least one '''swimlane level showing''' in the chart so that you have a '''swimlane level cell''' to use in the procedure described above. '''Only one swimlane''' can be moved at a time. To move '''two or more swimlanes''' to new positions, the operations must be done separately. |
| − | ''' | + | Moving a '''swimlane''' moves all the '''rows''' that are members of that '''swimlane'''. If there are multiple '''swimlane levels showing''' in the chart, selecting a '''higher level swimlane''' to move when there are '''lower level swimlanes as members''' also moves these '''lower level swimlanes'''. The '''Left#1 swimlane level''' is considered the '''highest level swimlane''' because it appears furthest to the left in the chart. When all three '''swimlane levels''' are present in the chart, the hierarchy is '''Left#1''', '''Left#2''', and '''Left#3''' as shown here: |
| − | + | <center>[[File:P70-12_10_1-(1)_07102020.png]]</center> | |
| + | <!--<center>P70-12_10_1-(1)_07102020.png</center>--> | ||
| − | + | The examples provide below demonstrates this hierarchy. '''Swimlanes''' can be '''moved within a swimlane level''' or '''moved between swimlane levels'''. '''Moving a swimlane''' makes the '''swimlane''' into a '''row maverick'''. | |
| − | + | ==Moving Swimlanes In the Chart - Example== | |
| − | + | For this example, only a single '''swimlane level''' is used to demonstrate the basic process. | |
| − | + | ||
| − | + | ===Selecting a Swimlane to Move=== | |
| − | + | To '''move a swimlane''', select the desired '''swimlane''' by clicking in its '''swimlane level cells''' as shown below: | |
| − | + | ||
| − | + | <center>[[File:P70-12_10_1-(2-1)-07102020.png]]</center> | |
| + | <!--<center>P70-12_10_1-(2-1)-07102020.png</center>--> | ||
| − | + | You can also select the '''swimlane''' by using the '''double-left-click''' to '''highlight''' the '''swimlane's label cell''' as shown here: | |
| − | + | <center>[[File:P70-12_10_1-(3)-07102020.png]]</center> | |
| + | <!--<center>P70-12_10_1-(3)-07102020.png</center>--> | ||
| − | + | With the '''swimlane''' selected, movement of the mouse '''up or down''' causes OnePager to show a '''highlight red line''' indicating the direction the mouse is moving and where the selected '''swimlane''' will be placed if the mouse left-click button is released. | |
| − | + | ||
| − | + | ===Moving a Swimlane Up or Down=== | |
| − | + | Below is an example where a '''swimlane''' is selected and the mouse is moved '''slightly down''': | |
| − | + | ||
| − | + | <center>[[File:P70-12_10_1-(4)-07102020.png]]</center> | |
| + | <!--<center>P70-12_10_1-(4)-07102020.png</center>--> | ||
| − | <center>[[File:P70- | + | If the mouse with the left-click button held down is moved '''down further''' the '''highlighted red line''' moves with it and indicated where the selected '''swimlane''' will be placed if the mouse left-click button were released at that position as shown here: |
| − | <!--<center>P70- | + | |
| + | <center>[[File:P70-12_10_1-(5)-07102020.png]]</center> | ||
| + | <!--<center>P70-12_10_1-(5)-07102020.png</center>--> | ||
| + | |||
| + | When the mouse left-click button is released in the position shown above, OnePager moves the selected '''swimlane''' to that position as shown below: | ||
| + | |||
| + | <center>[[File:P70-12_10_1-(6)-07102020.png]]</center> | ||
| + | <!--<center>P70-12_10_1-(6)-07102020.png</center>--> | ||
| + | |||
| + | In the example above there is only the '''Left#1 swimlane level''' present in the chart. As a result, moving a '''swimlane up or down''' in a '''single swimlane level''' chart results in placing it: (1) '''between other Left#1 swimlanes''', (2) between the '''top most swimlane and the chart's top frame''', or (3) between the bottom most swimlane and the chart's bottom frame'''. In the '''single swimlane level''' chart, the ends of the '''highlighted red line or key''' resembles a '''T''' on its side. | ||
| + | |||
| + | The example given above applies equally well when it is desired to select a '''single swimlane cell''' and move it '''up''' in the chart. When there are '''multiple swimlane levels''' present in the chart the '''highlighted red line and its key''' becomes more important as discussed below. | ||
===Interpretation of the Key on the Highlighted Red Line=== | ===Interpretation of the Key on the Highlighted Red Line=== | ||
| − | The '''key''' displayed on the left side of the '''highlighted red line''' can point '''up''' | + | The '''key''' displayed on the left side of the '''highlighted red line''' can point '''up''' or '''down or in both directions''' when moving a '''swimlane''' that is below the '''highest level swimlane showing''' in the chart. The examples that follow use a chart with three '''swimlane levels showing''' in the chart. |
====Key Points Down==== | ====Key Points Down==== | ||
| − | When the '''key''' points '''down''' the selected ''' | + | When the '''key''' points '''down''' the selected '''swimlane''' is positioned below the '''highlighted red line''' as shown in the sequence of two illustrations that follow: |
| − | <center>[[File:P70- | + | <center>[[File:P70-12_10_1-(7-1)-07102020.png]]</center> |
| − | <!--<center>P70- | + | <!--<center>P70-12_10_1-(7-1)-07102020.png</center>--> |
| − | <center>[[File:P70- | + | <center>[[File:P70-12_10_1-(8-1)-07102020.png]]</center> |
| − | <!--<center>P70- | + | <!--<center>P70-12_10_1-(8-1)-07102020.png</center>--> |
====Key Points Up==== | ====Key Points Up==== | ||
| − | The first example above shows where the selected ''' | + | The first example above shows where the selected '''swimlane''' is positioned when the '''key''' points '''up'''. Results are similar when the selected '''swimlane''' is positioned when the '''key''' points '''up'''. |
====Key Points Up and Down==== | ====Key Points Up and Down==== | ||
| − | The '''key''' can indicate that the selected ''' | + | The '''key''' can indicate that the selected '''swimlane''' will be positioned '''on the highlighted red line''' as shown in the sequence of two illustrations that follow: |
| − | + | ||
| − | + | ||
| − | + | ||
| + | <center>'''Before'''</center> | ||
| − | <center>[[File:P70- | + | <center>[[File:P70-12_10_1-(9-1)-07102020.png]]</center> |
| − | <!--<center>P70- | + | <!--<center>P70-12_10_1-(9-1)-07102020.png</center>--> |
| − | + | <center>'''After'''</center> | |
| − | + | <center>[[File:P70-12_10_1-(10)-08042020.png]]</center> | |
| + | <!--<center>P70-12_10_1-(10)-08042020.png</center>--> | ||
==Related Links== | ==Related Links== | ||
| Line 92: | Line 102: | ||
[[Editing Swimlane Properties for Version 7.0 | Editing Swimlane Properties]] <!--12.23.1-70--> | [[Editing Swimlane Properties for Version 7.0 | Editing Swimlane Properties]] <!--12.23.1-70--> | ||
| − | (12. | + | (12.10.1-70) |
[[Category:Version 7.0]] | [[Category:Version 7.0]] | ||
| Line 100: | Line 110: | ||
[[Category:Editing the Chart]] | [[Category:Editing the Chart]] | ||
[[Category:Rows and Swimlanes]] | [[Category:Rows and Swimlanes]] | ||
| + | [[Category:Multiple Swimlane Levels]] | ||
[[Category:Rows]] | [[Category:Rows]] | ||
[[Category:Text Columns]] | [[Category:Text Columns]] | ||
Revision as of 17:51, 14 January 2021
Contents
About Moving Swimlanes in the Chart
As it is with rows, for some schedule presentations the order of swimlanes in the chart done by OnePager may not be totally sufficient to meet your needs. Swimlanes can be manually moved up and down in the chart by selecting the appropriate swimlane level cell of the desired swimlane and, once selected, using the mouse drag and drop method on the selected swimlane to place it in the desired position.
OnePager provides assistance by highlighting the selected swimlane first and as the selected swimlane is dragged up or down providing a red line with a pointer to tell you where the dragged swimlane is to be dropped (placed at the end of the operation. Finally, releasing the mouse left-click button causes OnePager to place the selected swimlane in the designed or dropped position.
You must have at least one swimlane level showing in the chart so that you have a swimlane level cell to use in the procedure described above. Only one swimlane can be moved at a time. To move two or more swimlanes to new positions, the operations must be done separately.
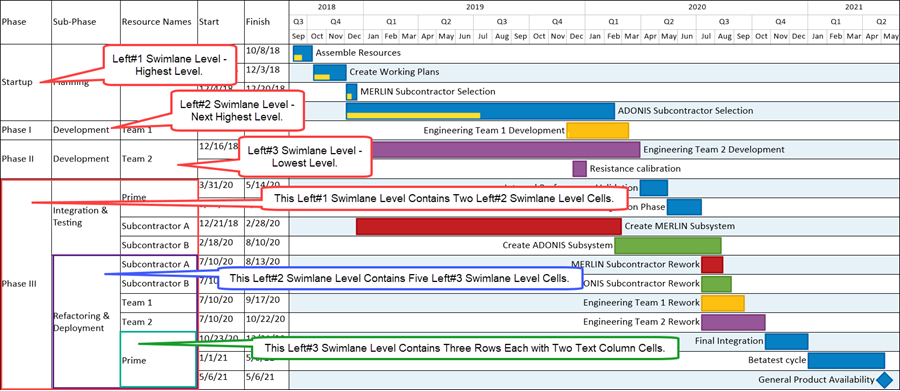
Moving a swimlane moves all the rows that are members of that swimlane. If there are multiple swimlane levels showing in the chart, selecting a higher level swimlane to move when there are lower level swimlanes as members also moves these lower level swimlanes. The Left#1 swimlane level is considered the highest level swimlane because it appears furthest to the left in the chart. When all three swimlane levels are present in the chart, the hierarchy is Left#1, Left#2, and Left#3 as shown here:
The examples provide below demonstrates this hierarchy. Swimlanes can be moved within a swimlane level or moved between swimlane levels. Moving a swimlane makes the swimlane into a row maverick.
Moving Swimlanes In the Chart - Example
For this example, only a single swimlane level is used to demonstrate the basic process.
Selecting a Swimlane to Move
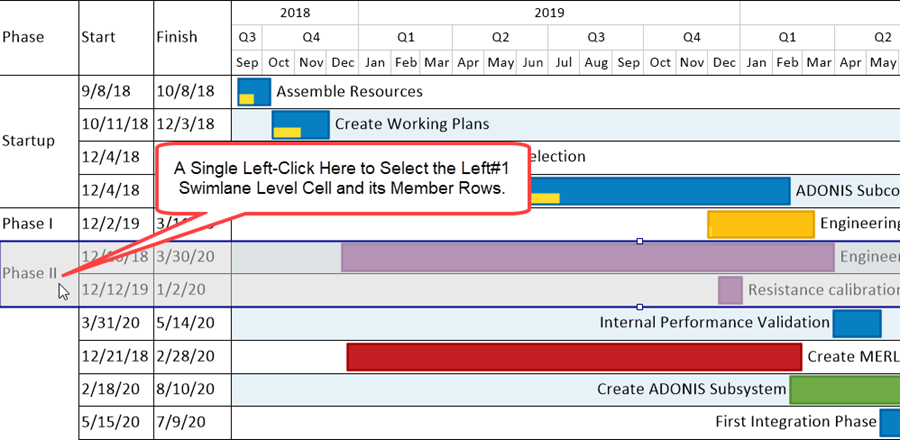
To move a swimlane, select the desired swimlane by clicking in its swimlane level cells as shown below:
You can also select the swimlane by using the double-left-click to highlight the swimlane's label cell as shown here:

With the swimlane selected, movement of the mouse up or down causes OnePager to show a highlight red line indicating the direction the mouse is moving and where the selected swimlane will be placed if the mouse left-click button is released.
Moving a Swimlane Up or Down
Below is an example where a swimlane is selected and the mouse is moved slightly down:

If the mouse with the left-click button held down is moved down further the highlighted red line moves with it and indicated where the selected swimlane will be placed if the mouse left-click button were released at that position as shown here:
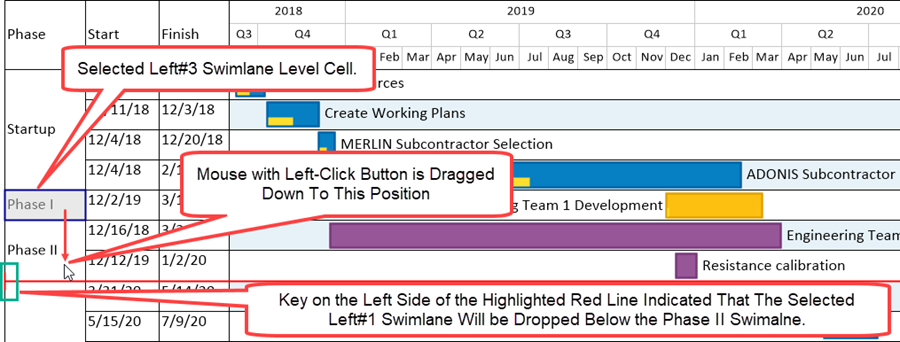
When the mouse left-click button is released in the position shown above, OnePager moves the selected swimlane to that position as shown below:
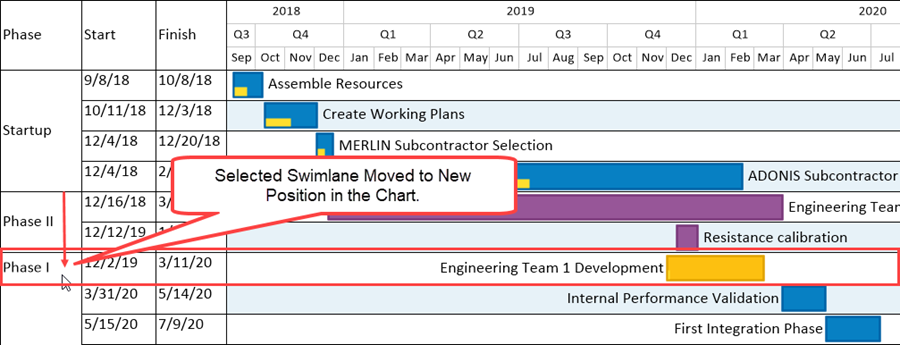
In the example above there is only the Left#1 swimlane level present in the chart. As a result, moving a swimlane up or down in a single swimlane level chart results in placing it: (1) between other Left#1 swimlanes, (2) between the top most swimlane and the chart's top frame, or (3) between the bottom most swimlane and the chart's bottom frame. In the single swimlane level chart, the ends of the highlighted red line or key resembles a T on its side.
The example given above applies equally well when it is desired to select a single swimlane cell and move it up in the chart. When there are multiple swimlane levels present in the chart the highlighted red line and its key becomes more important as discussed below.
Interpretation of the Key on the Highlighted Red Line
The key displayed on the left side of the highlighted red line can point up or down or in both directions when moving a swimlane that is below the highest level swimlane showing in the chart. The examples that follow use a chart with three swimlane levels showing in the chart.
Key Points Down
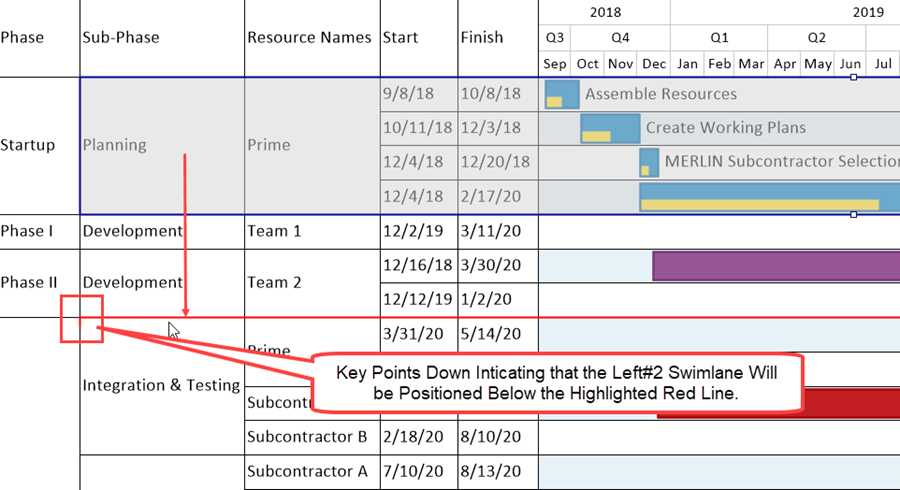
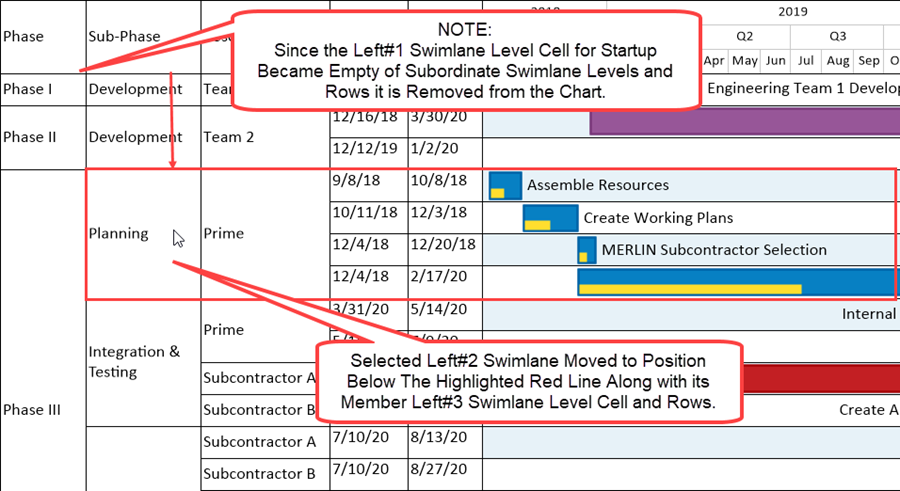
When the key points down the selected swimlane is positioned below the highlighted red line as shown in the sequence of two illustrations that follow:
Key Points Up
The first example above shows where the selected swimlane is positioned when the key points up. Results are similar when the selected swimlane is positioned when the key points up.
Key Points Up and Down
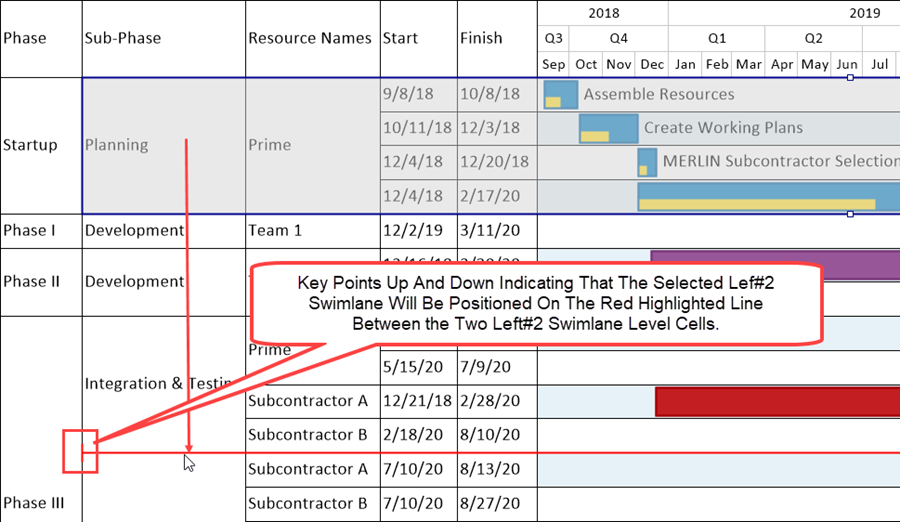
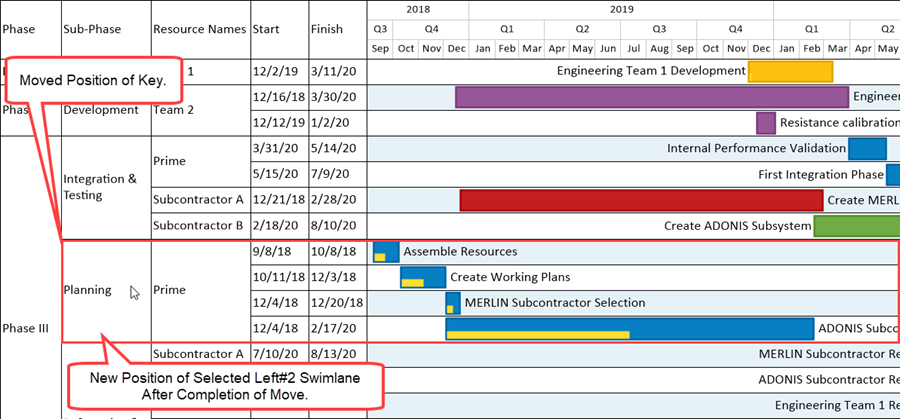
The key can indicate that the selected swimlane will be positioned on the highlighted red line as shown in the sequence of two illustrations that follow:
Related Links
Creating, Formatting, and Sorting Swimlanes Levels
Creating and Formatting Text Columns
Editing Text Columns or Swimlane Labels
Resizing the Width of Text Columns and Swimlanes
(12.10.1-70)