|
|
| Line 1: |
Line 1: |
| | ==Overview== | | ==Overview== |
| | | | |
| − | This article covers manual swimlane groupings, as opposed to the automatic, data-driven swimlanes that appear by default in OnePager charts. For more information on automatic '''swimlane groupings''', please see the article at: [[Creating, Formatting, and Sorting Swimlanes Levels for Version 7.0 | Creating, Formatting, and Sorting Swimlanes Levels]] <!--12.02.1-70-->
| + | In the context of this article, '''adding a row to a swimlane''' means making the manual '''addition''' to an existing chart. This is done through the use of the '''Add row to swimlane/At top of swimlane or Bottom of swimlane''' commands found in the '''swimlane level''' right-click '''context menus''' you have available in the chart as shown below. |
| | | | |
| − | In order to '''group rows into swimlanes''', at least two '''rows''' must be selected in the chart and at least one '''swimlane level '''must be '''defined''' for the chart. If only one '''row''' is selected, OnePager '''disables''' the '''Group rows into a swimlane '''command in the '''text column '''right-click '''context menu'''. Two or more '''rows''' may be '''grouped into swimlanes''' when one or more (all) '''swimlane levels''' are '''hidden'''. If these conditions are '''not met''', when the '''text column''' right-click '''context menu''' is accessed, the '''Group rows into a swimlane '''command is '''disabled''' as shown here:
| + | ===Swimlane Level Right-Click Context Menu=== |
| | | | |
| − | <center>[[File:P70-12_16_1-(2A)-07282020.png]]</center>
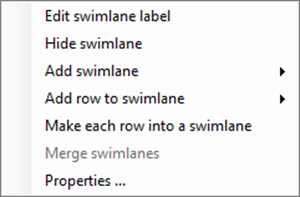
| + | The '''swimlane level''' right-click '''context menu''' looks like this: |
| − | <!--<center>P70-12_16_1-(2A)-07282020.png</center>-->
| + | |
| | | | |
| − | Since you can configure OnePager charts with up to three '''swimlane levels''', how '''rows''' are '''grouped into a swimlane''' depends on the membership of the '''row''' in the '''swimlane levels''' defined in the chart.
| + | <center>[[File:P70-12_16_1-(1A)-07282020.png]]</center> |
| | + | <!--<center>P70-12_16_1-(1A)-07282020.png</center>--> |
| | | | |
| − | This article discusses the '''various possible configurations '''for selected '''rows''' and how the '''Group rows into a swimlane '''command produces a consistent result in terms of the configuration of the '''new grouped swimlane''', its resulting '''position''' in the chart, and the '''labels''' assigned to the '''new grouped swimlane levels cells'''.
| + | For the purpose of this article, the focus is on the '''Add row to swimlane '''command and its sub-command. The '''swimlane level''' right-click '''context menu''' has commands for '''Add row to swimlane At top of swimlane or At bottom of swimlane''' as shown here: |
| | | | |
| − | Depending on the original configuration of the chart, the number of '''swimlane levels''' defined and '''showing''', the results of applying the '''Group rows into a swimlane '''command follows a consistent pattern discussed in this article.
| + | <center>[[File:P70-12_16_1-(1A)-07242020.png]]</center> |
| | + | <!--<center>P70-12_16_1-(1A)-07242020.png</center>--> |
| | | | |
| − | As an example, we can start by illustrating the results from '''grouping two rows from the same Left#3 swimlane level '''in the sequence shown below.
| + | In using the '''swimlane level''' right-click '''context menus''' shown in the illustration above, it is important to place the mouse cursor in the desired selection area before performing the right-click. To be able to use the '''swimlane level''' right-click '''context menu''', at least one '''swimlane level''' must be '''defined '''and ''' showing''' in the chart. The '''swimlane level '''right-click '''context menus''' can be used after selecting '''multiple swimlane level cells'''. |
| | | | |
| − | :1) Start by selecting the top two '''rows''' in the illustration below where these selected two '''rows''' are members of all '''three defined and shown swimlane levels'''.
| + | ==Adding Row to Swimlane At Top or Bottom of an Existing Swimlane == |
| | | | |
| − | :2) The '''text column''' right-click '''context menu''' is accessed, and the '''Group rows into a swimlane''' command is '''enabled''' as shown here:
| + | '''Maverick''' '''rows''' can be '''added''' to the chart at any '''swimlane level''' using the '''swimlane level '''right-click '''context menu’s''' command. You have two options within the selected '''swimlane''' as to where to place the '''added row''': (1) '''At top of swimlane''' or (2) '''At bottom of swimlane'''. A single '''row''' is '''added''' to the selected '''swimlane''' in the specified '''position'''. |
| | | | |
| − | <center>[[File:P70-12_18_1-(2)-07302020.png]]</center>
| + | The '''added row''' is '''empty''' of any task bars/milestone symbols, there are no '''labels''' in any '''text column cells''' associated with the '''added row''', and there is no '''label''' in the '''swimlane level cell''' created with the new '''row'''. |
| − | <!--<center>P70-12_18_1-(2)-07302020.png</center>-->
| + | |
| | | | |
| − | :3) When the '''Group rows into swimlane''' command is clicked the results are shown in the chart here:
| + | ===Adding a New Row at the Top of an Existing Swimlane - Example=== |
| | | | |
| − | <center>[[File:P70-12_18_1-(3-1)-08042020.png]]</center>
| + | ====Selecting a Single Row Level Cell - Example==== |
| − | <!--<center>P70-12_18_1-(3-1)-08042020.png</center>-->
| + | |
| | | | |
| − | The end result in the illustration above is the creation of a '''new Left#3 swimlane''' positioned below '''the original Left#3 swimlane '''with the '''new grouped swimlane''' having the '''label''' of the '''original Left#3 swimlane'''. | + | The following sequence of illustrations show how a '''row''' can be '''added''' to a '''Left#2 swimlane level '''using the '''At top of swimlane '''sub-command: |
| | | | |
| − | '''Rows''' are '''grouped into a swimlane''' at the '''lowest swimlane level'''. In the illustration above, the '''lowest swimlane level is Left#3'''. When there are two or more '''rows''' in the '''lowest swimlane level''' are selected and are member of '''higher level swimlane''', as shown in the above chart, the result of '''grouping rows into a swimlane''' applies only to the '''lowest level swimlane'''. As shown in the illustration above, these '''higher level swimlanes''' are not altered by the action taken to '''group rows into a swimlane at the lowest level swimlane'''. When these conditions are '''not met''', OnePager '''disables '''the '''Group rows into a swimlane''' command in the '''text column''' right-click '''context menu'''.
| + | :1) Right-click in the desired '''swimlane level cell''' to access the '''swimlane level''' right-click '''context menu''' as shown here: |
| | | | |
| − | Multiple '''rows''' in different '''Left#3 swimlane level cells''' can be selected and the '''Group rows into a swimlane '''command used to create a '''new grouping'''.
| + | <center>[[File:P70-12_16_1-(4)-07242020.png]]</center> |
| | + | <!--<center>P70-12_16_1-(4)-07242020.png</center>--> |
| | | | |
| − | ==Grouping Rows into a Swimlane – One Swimlane Level Chart==
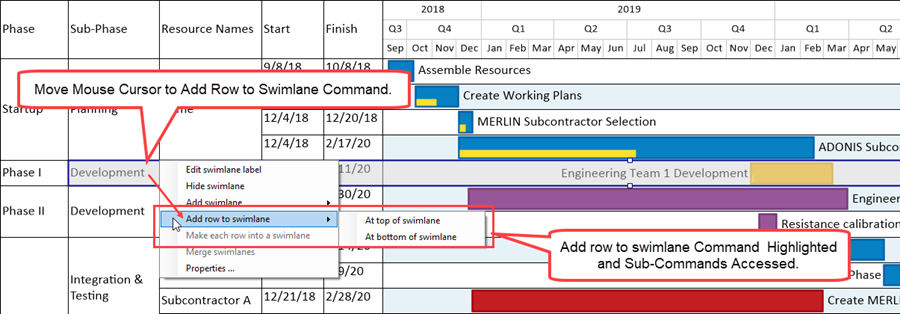
| + | :2) Next, move the mouse over to the '''Add row to swimlane''' command which automatically accesses the two sub-command as shown here: |
| | | | |
| − | To better illustrate how the '''Group rows into a swimlane '''command operates in the multiple swimlane level environment we start with the situation where one '''swimlane level''' is '''defined''' and '''showing''' in the chart. In the sub-sections that follow, we start with the '''Left#1 swimlane level defined '''and '''showing''' as the simplest case and proceed step-wise to demonstrated OnePager’s '''Group rows into a swimlane''' when there are '''two and three swimlane levels defined''' and '''showing''' in the chart.
| + | <center>[[File:P70-12_16_1-(10)-07272020.png]]</center> |
| | + | <!--<center>P70-12_16_1-(10)-07272020.png</center>--> |
| | | | |
| − | ===Grouping Rows into a Swimlane from the Same Left#1 Swimlane Level Cell===
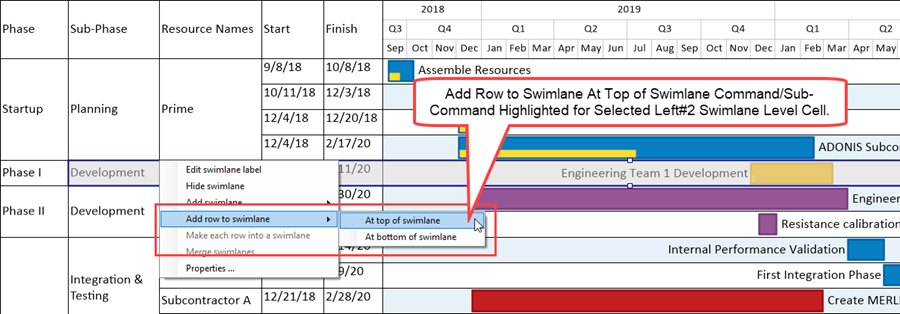
| + | :3) Select the '''At top of swimlane''' sub-command by moving the mouse to the '''At top of swimlane''' sub-command as shown below: |
| | | | |
| − | '''Grouping rows into a swimlane''' can be illustrated in the '''one swimlane level''' chart shown here as our starting point:
| + | <center>[[File:P70-12_16_1-(11)-07272020.png]]</center> |
| | + | <!--<center>P70-12_16_1-(11)-07272020.png</center>--> |
| | | | |
| − | <center>[[File:P70-12_18_1-(4)-07312020.png]]</center>
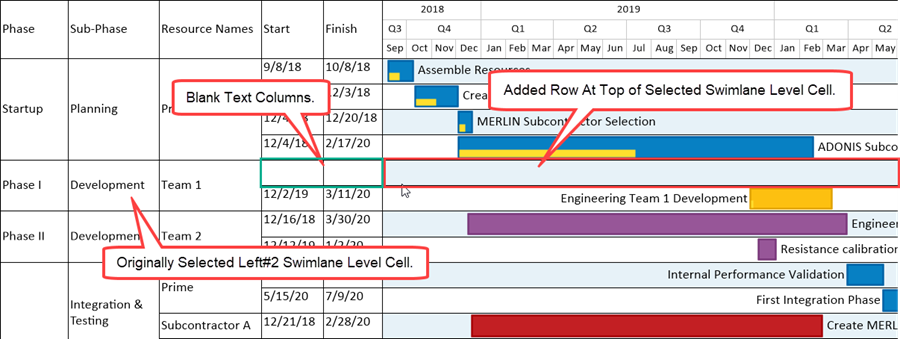
| + | :4) When the '''Add row to swimlane/At top of swimlane''' command/sub-command is clicked, OnePager places a '''blank row at the top of''' '''the selected''' '''swimlane level cell''' that is '''empty''' of task bars/milestone symbols and with '''blank text column cells''', if any, as shown here: |
| − | <!--<center>P70-12_18_1-(4)-07312020.png</center>-->
| + | |
| | | | |
| − | Suppose you’d like to take the '''four rows''' in the '''Startup swimlane''' and '''group''' them so that there are '''two Startup Left#1 swimlane level cells''' in the chart. To do this, select the '''two top rows''' in the '''Startup swimlane''' using the '''CTL+Left-Click''' method, right-click in one of the selected '''text column cells''' to access the '''text column''' right-click '''context menu, '''and prepare to click the '''Group rows into a swimlane '''command as shown below:
| + | <center>[[File:P70-12_16_1-(12)-07272020.png]]</center> |
| | + | <!--<center>P70-12_16_1-(12)-07272020.png</center>--> |
| | | | |
| − | <center>[[File:P70-12_18_1-(5-1)-08042020.png]]</center>
| + | In the case illustrated above, the new '''row''' becomes the '''top row''' of the selected '''swimlane '''shown in the above chart portion. The '''row''' added '''at the top''' of the selected '''swimlane level cell''' in the above example is a member of all three '''swimlane levels'''. A similar result is achieved when the selected command/sub-command combination is '''Add row to swimlane/At bottom of swimlane'''. |
| − | <!--<center>P70-12_18_1-(5-1)-08042020.png</center>-->
| + | |
| | | | |
| − | When the '''Group rows into a swimlane''' command is clicked, the two selected '''rows''' become a new '''Left#1 swimlane''' with '''Startup''' as its '''Left#1 swimlane level cell label''' '''positioned below''' the original '''Left#1 swimlane level cell label''' as shown here:
| + | ====Selecting Multiple Row Levels Cell - Example==== |
| | | | |
| − | <center>[[File:P70-12_18_1-(5)-07312020.png]]</center>
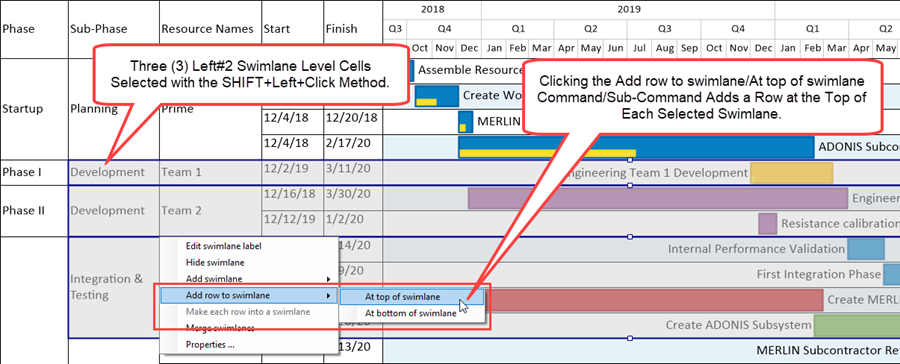
| + | '''Rows''' can be '''added''' to '''multiple swimlane level cells''' by selecting '''multiple swimlane level cells''' in the same '''swimlane '''as shown below: |
| − | <!--<center>P70-12_18_1-(5)-07312020.png</center>-->
| + | |
| | | | |
| − | When selected '''rows''' are '''grouped into a swimlane''' within an existing '''swimlane level cell''', OnePager places the '''new grouped swimlane below''' the original '''swimlane level cell''' to draw attention to the '''new grouping'''. OnePager assumes that the reason for '''grouping rows into a swimlane''' is that, in most schedule presentation situations, the '''new grouped rows''' (now a '''swimlane '''on its own) will be '''re-positioned''' elsewhere in the chart and potentially the '''new grouped swimlane level cell label''' will be '''edited'''. As a result, you have the option to retain the '''new grouped rows''' in the OnePager designated '''position''' or move the '''new grouped swimlane '''using the '''drag and drop''' method to a different '''position''' in the chart.
| + | <center>[[File:P70-12_16_1-(13)-07272020.png]]</center> |
| | + | <!--<center>P70-12_16_1-(13)-07272020.png</center>--> |
| | | | |
| − | For more information on '''moving swimlanes''', please see the article at: [[Moving Swimlanes for Version 7.0 | Moving Swimlanes]] <!--12.10.1-70-->
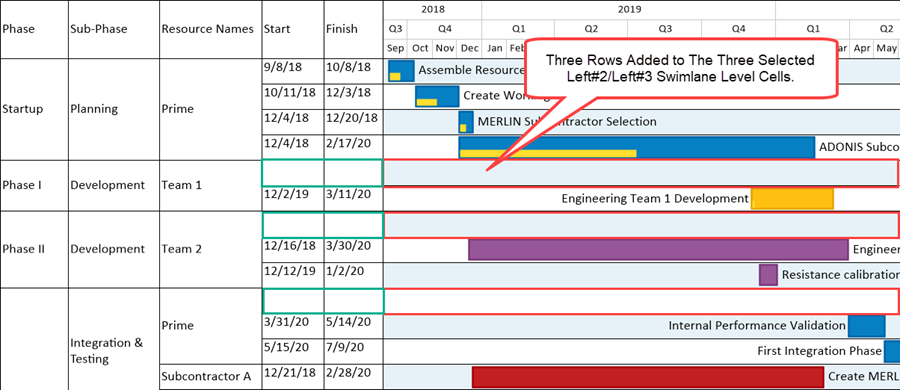
| + | When the command/sub-command is clicked, OnePager places three '''empty Left#2/Left#3 swimlanes''' into the chart as shown here: |
| | | | |
| − | Once the '''new swimlane''' is created containing the two selected '''rows''' shown above, the '''new swimlane''' can be '''edited''' the same as any other '''swimlane''' in the chart. '''Edits''' can include changing the '''label''' in the '''Left#1 swimlane level cell''', '''dragging and dropping''' the '''new swimlane''' to another '''position''' in the chart, or changing its '''background color''' in some fashion.
| + | <center>[[File:P70-12_16_1-(14)-07272020.png]]</center> |
| | + | <!--<center>P70-12_16_1-(14)-07272020.png</center>--> |
| | | | |
| − | For more information on '''editing rows and swimlanes''' please see the two articles at: [[Editing Row Properties for Version 7.0 | Editing Row Properties]] <!--12.22.1-70--> and [[Editing Swimlane Properties for Version 7.0 | Editing Swimlane Properties]] <!--12.23.1-70-->
| + | In the case illustrated above, the new '''rows''' become the '''top row''' of each of the three '''swimlane levels''' '''shown''' in the above chart portion. The '''row''' added '''at the top''' of the selected '''swimlane level cells''' in the above example is a member of all three '''swimlane levels'''. |
| | | | |
| − | ===Grouping Rows into a Swimlane from Different Left#1 Swimlane Level Cells=== | + | ===Adding a New Row at the Bottom of an Existing Swimlane === |
| | | | |
| − | To illustrate what happens when '''rows''' are selected from '''different Left#1 swimlane level cells''', we again start with the original chart configuration shown below:
| + | A similar result is achieved when the selected command/sub-command combination is '''Add row to swimlane/At bottom of swimlane'''. |
| − | | + | |
| − | <center>[[File:P70-12_18_1-(4)-07312020.png]]</center>
| + | |
| − | <!--<center>P70-12_18_1-(4)-07312020.png</center>-->
| + | |
| − | | + | |
| − | For this example, lets select one '''row''' in the '''Startup Left#1 swimlane''' and three '''rows''' in the '''Phase III Left#1 swimlane''' as shown here:
| + | |
| − | | + | |
| − | <center>[[File:P70-12_18_1-(7)-08032020.png]]</center>
| + | |
| − | <!--<center>P70-12_18_1-(7)-08032020.png</center>-->
| + | |
| − | | + | |
| − | When the '''Group rows into a swimlane''' command is clicked, the four selected '''rows''' become a '''new Left#1 swimlane''' with '''Phase III''' as its '''Left#1 swimlane level cell label''' '''positioned below''' the bottom '''Left#1 swimlane level cell label''' as shown here:
| + | |
| − | | + | |
| − | <center>[[File:P70-12_18_1-(8)-08032020.png]]</center>
| + | |
| − | <!--<center>P70-12_18_1-(8)-08032020.png</center>-->
| + | |
| − | | + | |
| − | Comparing the original with the resulting chart after '''grouping the four selected rows into a swimlane''', shown above, illustrates how OnePager handles one '''swimlane level''' case where '''rows''' are selected from '''different swimlanes'''.
| + | |
| − | | + | |
| − | :* The '''new grouped rows '''are placed together in sequence from top to bottom order.
| + | |
| − | :* The '''new grouped swimlane''' is placed at the bottom of the chart.
| + | |
| − | :* The '''new grouped Left#1 swimlane cell’s label''' is taken as the '''modal value''' from the '''origin swimlane labels''' associated with the '''original''' selected '''rows'''.
| + | |
| − | :* In this case, one selected '''row '''came from the '''Startup Left#1 swimlane''' and three '''rows''' came from the '''Phase III Left#1 swimlane'''.
| + | |
| − | :* As '''Phase III''' is the '''modal swimlane cell label''', the '''new grouped Left#1 swimlane''' takes the '''Phase III swimlane cell label'''.
| + | |
| − | | + | |
| − | ==Grouping Rows into a Swimlane – Two Swimlane Level Chart==
| + | |
| − | | + | |
| − | In the sub-sections that follow, we add the '''Left#2 swimlane level''' to the already present '''Left#1 swimlane level'''. Adding the '''Left#2 swimlane level''' to the original chart gives us a chart with this configuration:
| + | |
| − | | + | |
| − | <center>[[File:P70-12_18_1-(9)-08032020.png]]</center>
| + | |
| − | <!--<center>P70-12_18_1-(9)-08032020.png</center>-->
| + | |
| − | | + | |
| − | ===Grouping Rows into a Swimlane from the Same Left#2 and Left#1 Swimlane Level Cells===
| + | |
| − | | + | |
| − | Selecting multiple '''rows''' from the '''same Left#2 and Left#1 swimlane level cell''' is the same as the example above for '''grouping rows into a swimlane from the same Left#1 swimlane level cell''' when there is no '''Left#2 swimlane level''' configured in the chart.
| + | |
| − | | + | |
| − | Because the results are the same, please refer back to the example at: [[Grouping Rows into Swimlanes for Version 7.0#Grouping Rows into a Swimlane from the Same Left#1 Swimlane Level Cell | Grouping Rows into a Swimlane from the Same Left#1 Swimlane Level Cell]] <!-- 12.18.1-70-->
| + | |
| − | | + | |
| − | ===Grouping Rows into a Swimlane from Different Left#2 and Left#1 Swimlane Level Cells===
| + | |
| − | | + | |
| − | There are two situations here to explore: (1) The first is where the '''Left#1 swimlane levels''' are the '''same''' but the '''Left#2 swimlane levels''' are '''different''' for the selected '''rows''' and (2) where the '''Left#1 swimlane levels''' may be the '''same''' or '''different''' and the selected '''rows''' are in '''different Left#2 swimlane levels'''. We’ll take each in turn.
| + | |
| − | | + | |
| − | ====Rows Selected from the Same Left#1 Swimlane Levels but Different Left#2 Swimlane Levels====
| + | |
| − | | + | |
| − | To illustrate this first situation, consider the five selected '''rows''' shown in the chart below:
| + | |
| − | | + | |
| − | <center>[[File:P70-12_18_1-(10)-08032020.png]]</center>
| + | |
| − | <!--<center>P70-12_18_1-(10)-08032020.png</center>-->
| + | |
| − | | + | |
| − | When the '''Group rows into a swimlane''' command is clicked, the chart is reconfigured as shown below:
| + | |
| − | | + | |
| − | <center>[[File:P70-12_18_1-(11)-08032020.png]]</center>
| + | |
| − | <!--<center>P70-12_18_1-(11)-08032020.png</center>-->
| + | |
| − | | + | |
| − | Comparing the original with the resulting chart after '''grouping the five selected rows into a swimlane''', shown above, illustrates how OnePager handles the two '''swimlane level''' case where '''rows''' are selected from '''different Left#2 swimlanes '''residing in the '''same Left#1 swimlane'''.
| + | |
| − | | + | |
| − | :* The '''new grouped rows''' are placed together in sequence from top to bottom order.
| + | |
| − | :* The '''new grouped swimlane''' is placed at the bottom of the involved '''Left#1 swimlane''' ('''Phase III'''), usually the bottom of the chart.
| + | |
| − | :* The '''new grouped Left#2 swimlane cell’s label''' is taken as the '''modal value''' from the '''origin Left#2 swimlane cell label''' associated with the '''original''' selected '''rows'''.
| + | |
| − | :* In this case, two selected '''row '''came from the '''Integration & Testing Left#2 swimlane''' and three '''rows''' came from the '''Refactoring & Deployment Left#2 swimlane'''.
| + | |
| − | :* As '''Refactoring & Deployment''' is the '''modal Left#2 swimlane cell’s label''', the '''new grouped Left#2 swimlane''' takes the '''Refactoring & Deployment swimlane cell label'''.
| + | |
| − | | + | |
| − | ====Rows Selected from Different Left#1 Swimlane Levels and Different Left#2 Swimlane Levels====
| + | |
| − | | + | |
| − | To consider this illustration carefully, let’s take a fresh look back at the original chart shown here:
| + | |
| − | | + | |
| − | <center>[[File:P70-12_18_1-(9)-08032020.png]]</center>
| + | |
| − | <!--<center>P70-12_18_1-(9)-08032020.png</center>-->
| + | |
| − | | + | |
| − | To illustrate the second situation, three '''rows''' are selected from the '''same Left#1 and Left#2 swimlanes''' and two '''rows''' are selected from '''different Left#1 and Left#2 swimlanes''' from the three '''rows''' selected at the top of the chart as shown below:
| + | |
| − | | + | |
| − | <center>[[File:P70-12_18_1-(12)-08032020.png]]</center>
| + | |
| − | <!--<center>P70-12_18_1-(12)-08032020.png</center>-->
| + | |
| − | | + | |
| − | The illustration remains valid even if the three '''rows''' selected at the top of the chart were selected from '''different Left#1 and Left#2 swimlanes'''. The illustration is meant to show the results from selecting '''rows''' in '''different Left#1 and Left#2 swimlanes'''.
| + | |
| − | | + | |
| − | When the '''Group rows into a swimlane '''command is clicked, the chart is reconfigured as shown below:
| + | |
| − | | + | |
| − | <center>[[File:P70-12_18_1-(13)-08032020.png]]</center>
| + | |
| − | <!--<center>P70-12_18_1-(13)-08032020.png</center>-->
| + | |
| − | | + | |
| − | Again, comparing the original with the resulting chart after '''grouping the five selected rows into a swimlane''', shown above, illustrates how OnePager handles the two '''swimlane level''' case where '''rows''' are selected from '''different Left#1 and Left#2 swimlanes'''.
| + | |
| − | | + | |
| − | :* The '''new grouped rows''' are placed together in sequence from top to bottom order.
| + | |
| − | :* The '''new grouped swimlane''' is placed at the bottom of the chart.
| + | |
| − | :* The '''new grouped Left#2 swimlane cell’s label''' is taken as the '''modal value''' from the '''origin Left#2 swimlane cell label''' associated with the '''original''' three selected '''rows'''.
| + | |
| − | :* The '''new grouped Left#1 swimlane cell’s label''' is taken as the '''modal value''' from the '''origin Left#1 swimlane cell label''' associated with the '''original''' three selected '''rows'''.
| + | |
| − | :* In this case, three selected '''row '''came from the '''Startup Left#1 swimlane '''and '''Planning Left#2 swimlane'''.
| + | |
| − | | + | |
| − | ==Grouping Rows into a Swimlane – Three Swimlane Level Chart==
| + | |
| − | | + | |
| − | In the sub-sections that follow, we add the '''Left#3 swimlane level''' to the already '''defined '''and '''showing''' '''Left#1 and Left#2 swimlane levels'''. Adding the '''Left#3 swimlane level''' to the original chart produces a chart with this configuration:
| + | |
| − | | + | |
| − | <center>[[File:P70-12_18_1-(14)-08032020.png]]</center>
| + | |
| − | <!--<center>P70-12_18_1-(14)-08032020.png</center>-->
| + | |
| − | | + | |
| − | If you’ve followed along through the discussions involving configurations of '''one''' and '''two swimlane levels''' in the chart, you can rightly suspect that the various combinations involving '''three swimlane levels''' with selected '''rows''' from the '''same or different swimlane levels''' follows a recurring pattern. Your suspicions are correct. So to reduce the number of possible examples, we’ll eliminate coverage of the situation where selected '''rows''' come from the same '''Left#1, Left#2, and Left#3 swimlanes'''.
| + | |
| − | | + | |
| − | In this sub-section we’ll cover only the case where '''three rows''' are selected from '''different Left#1, Left#2, and Left#3 swimlanes'''. In a chart with '''three swimlane levels''', the examples in the previous sub-sections (where we discussed selecting '''rows''' in a '''single swimlane level''' chart and a '''two swimlane level''' chart) applies to the '''three swimlane level''' chart where '''rows''' are selected from a '''single swimlane level''' or '''two different swimlane levels'''.
| + | |
| − | | + | |
| − | ====Rows Selected from Different Left#1, Left#2, and Left#3 Swimlane Levels ====
| + | |
| − | | + | |
| − | To illustrate the three '''swimlane level''' chart configuration, three '''rows''' are selected from the '''different Left#1, Left#2, and Left#3 swimlane levels''' as shown below:
| + | |
| − | | + | |
| − | <center>[[File:P70-12_18_1-(15)-08032020.png]]</center>
| + | |
| − | <!--<center>P70-12_18_1-(15)-08032020.png</center>-->
| + | |
| − | | + | |
| − | Please note that in the above chart there are '''no modal swimlane level cell labels'''. That is, there are an equal number of '''rows''' selected for each of the '''three different swimlane levels'''.
| + | |
| − | | + | |
| − | After clicking the '''Group rows into a swimlane '''command, the chart looks like this:
| + | |
| − | | + | |
| − | <center>[[File:P70-12_18_1-(16-1)-08042020.png]]</center>
| + | |
| − | <!--<center>P70-12_18_1-(16-1)-08042020.png</center>-->
| + | |
| − | | + | |
| − | For the example in this sub-section, comparing the original with the resulting chart after '''grouping the three selected rows into a swimlane''', shown above, illustrates how OnePager handles the three '''swimlane level''' case where '''rows''' are selected from '''different Left#1, Left#2 and Left#3 swimlane levels'''.
| + | |
| − | | + | |
| − | :* The '''new grouped rows''' are placed together in sequence from top to bottom order.
| + | |
| − | :* The '''new grouped swimlane '''is placed at the bottom of the chart.
| + | |
| − | :* Since only one '''row''' was selected in each combination of '''swimlane levels''', there are no '''modal Left#1''', '''Left#2''', and '''Left#3 swimlane level cell labels''' in the '''new grouping''' of three selected '''rows'''.
| + | |
| − | :* Under this condition, OnePager selects the '''labels''' for '''new grouped swimlane level cells''' at '''random''' for the three '''rows'''.
| + | |
| − | :* OnePager uses just the '''random '''selection of resulting '''swimlane level cell label''' in anticipation that you will most likely '''edit '''the''' three grouped level swimlane cell labels''' to meet your specific schedule presentation needs.
| + | |
| − | | + | |
| − | Regardless of the number of '''rows''' selected and used with the '''Group rows into a swimlane '''command, OnePager uses the '''random''' selection of '''grouped swimlane level cell’s labels''' to populate the corresponding '''new grouped swimlane level cell labels'''. In the illustration above, the '''random''' selection happened to be the three '''bottom most Left#1''', '''Left#2''', and '''Left#3 swimlane level cell labels'''.
| + | |
| | | | |
| | ==Related Links== | | ==Related Links== |
| Line 227: |
Line 109: |
| | [[Editing with the Chart Properties form for Version 7.0 (Portal) | Editing with the Chart Properties form (Portal)]] <!--21.0.1-70--> | | [[Editing with the Chart Properties form for Version 7.0 (Portal) | Editing with the Chart Properties form (Portal)]] <!--21.0.1-70--> |
| | | | |
| − | [[Managing Templates for Version 7.0 (Portal) | Managing Templates (Portal)]] <!--24.0.1-70--> | + | [[Managing Templates for Version 7.0 (Portal) | Managing Templates (Portal)]] <!--24.0.1-7--> |
| | | | |
| − | (12.18.1-70) | + | (12.19.1-70) |
| | | | |
| | [[Category:Version 7.0]] | | [[Category:Version 7.0]] |
A similar result is achieved when the selected command/sub-command combination is Add row to swimlane/At bottom of swimlane.
