Difference between pages "Legend Position Options for Multi-Page Outputs" and "REPLACING a Snapshot via Pull Operation for Version 7.2"
(→Related Links) |
|||
| Line 1: | Line 1: | ||
| − | == | + | ==Overview== |
| − | + | The real power of the '''Pull''' operation is to let you perform repeated snapshot '''REPLACE''' and snapshot '''ADD''' operations on an '''open''' chart. In other words, the '''Pull''' operation’s main purpose is to let you '''update the on-screen chart''' as you '''edit''' the chart's '''source plan'''. Illustrations used in this article are from OnePager Pro using data from Microsoft Project but the feature's function, controls, and manual edits apply equally to other OnePager editions that import from data sources like Microsoft Excel, Smartsheet, and Oracle Primavera P6. | |
| − | + | ==What is a Pull Operation?== | |
| − | + | A '''Pull''' operation starts in the '''Chart Editor'''. That is, you already have OnePager running and decide to '''update the open chart''' or (rarely) create a '''new''' chart. In contrast, a '''Push''' operation begins in the '''OnePager Pro Start''' from which you use to make a '''new''' chart or '''update an existing chart'''. We added the '''Pull''' operation because we found that OnePager users were often creating a chart and finding something in the '''source plan''' that they needed to change. After recognizing the need for a change, they are going back to the '''source plan''', making the change, and then re-launching OnePager to '''update the chart'''. The '''Pull''' operation lets you '''open''' a chart and '''update it repeatedly''' as you '''edit''' its '''source plan'''. After each set of changes to the '''source plan(s)''', you can quickly see the effect in the '''Chart Editor''' by using the OnePager '''Data''' ribbon tool bar tab to '''Pull''' the '''source plan''' changes into the chart. | |
| − | + | For more information on '''Creating a new chart using the Pull operation''', please see the article at: [[Creating a NEW Chart via Pull Operation Feature for Version 7.2 | Creating a NEW Chart via Pull Operation Feature]] 7.13.1-72 | |
| − | + | For more information on '''Adding a snapshot using the Pull operation''', please see the article at: [[ADDING a Snapshot via Pull Operation for Version 7.2 | ADDING a Snapshot via Pull Operation]] 7.15.1-72 | |
| − | + | The example below illustrates replacing a snapshot. | |
| − | + | ==Replacing a Snapshot Example== | |
| − | + | Let’s suppose you have a Microsoft Project '''source plan''' with an already created a snapshot for a particular '''date''', say, 8/1/2019. However, on 8/13/2019 you receive new information that updates your Microsoft Project '''source plan'''. You now want to '''update''' the OnePager chart’s snapshot for 8/13/2019 to reflect the new information. Further, let’s suppose that there are two (2) different charts created form this one Microsoft Project '''source plan''': | |
| − | + | :1) One for the PMO audience created with the '''Flag20''' field and | |
| − | + | :2) The second created for the '''customer''' audience created with the '''Flag10''' field. | |
| − | + | In this example, we’ll do a '''replacement''' for the PMO audience first and then do the same '''replacement''' for the '''customer''' audience. Since the Microsoft Project '''source plan''' was '''updated''' and now reflects the '''latest information for 8/14/2019''', we just need to use the '''Pull''' operation to access the '''updated''' Microsoft Project '''source plan''' data and '''replace''' the snapshots for the two audiences. | |
| − | + | ===Launching OnePager Pro from Microsoft Project=== | |
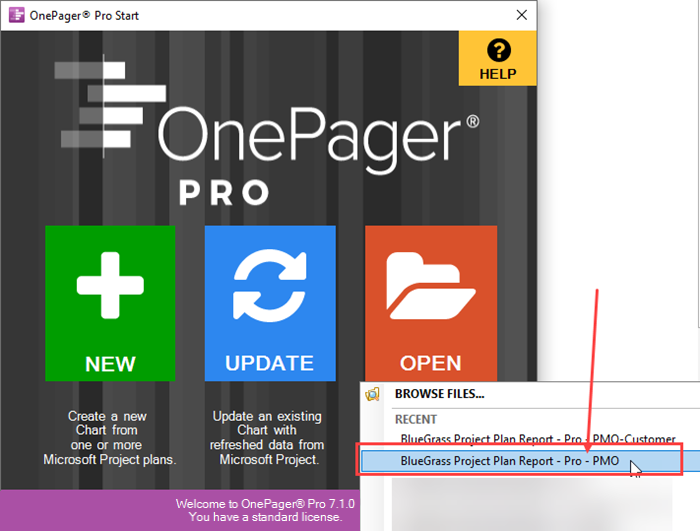
| − | + | First, '''update''' the Microsoft Project '''source plan''' with the '''updated''' data you want to '''replace''' in the snapshot. Launch '''OPP''' from Microsoft Project and when the '''OnePager Pro Start''' form appears click the '''OPEN''' button which, in our example, provides a dropdown menu with the name of the chart you wish to '''update''' by '''replacement'''. In this case it’s '''BlueGrass Project Plan Report - Pro - PMO''' as shown below: | |
| − | + | <center>[[File:P71-7_14_1-71-(1)-11102021.png]]</center> | |
| + | <!--<center>P71-7_14_1-71-(1)-11102021.png</center>--> | ||
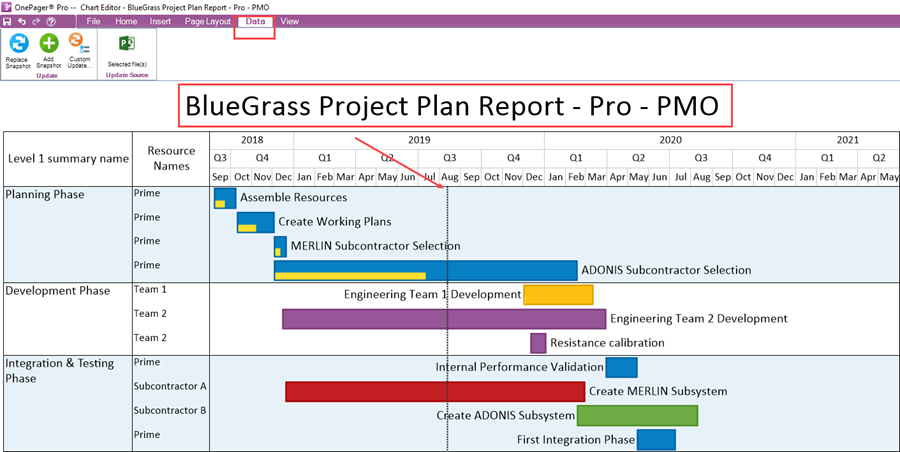
| − | + | The '''OPP Add-in''' application accesses the selected chart and places it in the '''Chart Editor'''. This is the chart and snapshot we want to replace. To proceed with the '''replacement''', click the '''Data''' tab on the ribbon. The '''Chart Editor''' looks like this: | |
| − | + | <center>[[File:P70-7_14_1-70-(2)-08132019.png]]</center> | |
| + | <!--<center>P70-7_14_1-70-(2)-08132019.png</center>--> | ||
| − | + | ===Use the Microsoft Project Source Plan to Replace a Snapshot=== | |
| − | + | To perform the '''replacement''' of the snapshot showing in the '''Chart Editor''', click the '''Replace Snapshot''' button on the '''Data''' tab as shown below: | |
| − | + | <center>[[File:P70-7_14_1-70-(3)-08132019.png]]</center> | |
| + | <!--<center>P70-7_14_1-70-(3)-08132019.png</center>--> | ||
| − | + | '''OPP''' performs this action by accessing the '''updated''' Microsoft Project '''source plan''' and using these data to '''update''' the snapshot as shown above. For a chart with multiple snapshots it is important to make sure that you have selected the '''correct''' snapshot to display in the '''Chart Editor''' before clicking the '''Replace Snapshot''' button. OnePager knows which snapshot is being displayed and '''replaces''' the snapshot in the '''Chart Editor''' with data from the parent Microsoft Project '''source plan'''. Navigating between snapshots in a multiple snapshot chart can be done prior to the above action by using the OnePager '''View''' ribbon tool bar tab as shown here: | |
| − | + | <center>[[File:P70-7_14_1-70-(4)-08132019.png]]</center> | |
| + | <!--<center>P70-7_14_1-70-(4)-08132019.png</center>--> | ||
| − | + | The replaced snapshot for chart '''BlueGrass Project Plan Report - Pro - PMO''' is shown below: | |
| − | + | <center>[[File:P70-7_14_1-70-(5)-08132019.png]]</center> | |
| + | <!--<center>P70-7_14_1-70-(5)-08132019.png</center>--> | ||
| − | + | Since we are using the '''OPP Add-in''' application for this example, it was not necessary to re-launch Microsoft Project. As long as you’ve properly prepared your Microsoft Project '''source plan''' that is all that is necessary to utilize the new '''Pull''' operation. At this point it is recommended that you '''save''' this the chart for access later. | |
| − | + | ===Preparing a Second Chart for Snapshot Replacement=== | |
| − | + | There are two (2) ways of updating the second chart from the same Microsoft Project '''source plan''': | |
| − | + | :1) After '''saving''' the first chart, close the '''OPP Add-in''' application and repeat the above process by '''opening''' the second chart and then using the '''Flag10''' field to select the tasks. | |
| − | + | :2) Remain in the current '''OPP Add-in''' '''Chart Editor''' and '''update''' the second chart from there. | |
| − | + | Here we demonstrates the second method as it is more efficient. With the first chart visible in the '''Chart Editor''', click on the '''File''' tab on the ribbon and then click the '''Open…''' tab on the page that appears. Then, click the chart name for the '''customer''' audience as shown below: | |
| − | + | <center>[[File:P70-7_14_1-70-(6)-12042020.png]]</center> | |
| + | <!--<center><P70-7_14_1-70-(6)-12042020.png></center>--> | ||
| − | + | When you click the desired chart '''name''' as shown above, OnePager displays that chart in a separate '''Chart Editor''' as shown here: | |
| − | <center>[[File: | + | <center>[[File:P70-7_14_1-70-(7)-12042020.png]]</center> |
| + | <!--<center><P70-7_14_1-70-(7)-12042020.png></center>--> | ||
| − | + | You can expand this '''Chart Editor''' window. Now, navigate to the OnePager '''Data''' ribbon tool bar tab as shown below: | |
| − | <center>[[File: | + | <center>[[File:P70-7_14_1-70-(8)-08132019.png]]</center> |
| + | <!--<center>P70-7_14_1-70-(8)-08132019.png</center>--> | ||
| − | + | Clicking the '''Replace Snapshot''' button on the OnePager '''Data''' ribbon tool bar tab tells '''OPP''' to go to the parent Microsoft Project '''source plan''' for this chart, perform the snapshot '''replacement''' under the control of the '''Flag10''' field of the '''source plan''', and display the results in the current '''Chart Editor'''. The '''replaced''' snapshot is shown below: | |
| − | : | + | <center>[[File:P70-7_14_1-70-(9)-08132019.png]]</center> |
| + | <!--<center>P70-7_14_1-70-(9)-08132019.png</center>--> | ||
| − | + | In this example we used the '''Pull''' operation twice to update two charts from the same Microsoft Project '''source plan''' but using different '''flag''' fields. Now that the second chart is created, we recommend that it too be '''saved''' for future access. | |
| − | == | + | ===Compare Results, Edit, Copy to PowerPoint=== |
| − | + | Once you are satisfied with your charts you can '''save''' them, '''copy''' them into Microsoft PowerPoint presentations, or '''share''' time in other ways. The '''Pull''' operation is an easy, fast, and convenient way to create multiple charts which makes you more efficient. | |
| − | + | ==Related Links== | |
| − | + | [[Creating a NEW Chart via Pull Operation Feature for Version 7.2 | Creating a NEW Chart via Pull Operation Feature]] 7.13.1-72 | |
| − | + | [[ADDING a Snapshot via Pull Operation for Version 7.2 | ADDING a Snapshot via Pull Operation]] 7.15.1-72 | |
| − | + | [[Custom Update (Replacing) of a Snapshot via Pull Operation for Version 7.2 | Custom Update (Replacing) of a Snapshot via Pull Operation]] 7.16.1-72 | |
| − | + | [[Using the OnePager "Data" Tab's "Selected file(s)" Button for Version 7.2 | Using the OnePager "Data" Tab's "Selected file(s)" Button]] 7.17.1-72 | |
| − | + | (7.14.1-72) | |
| − | + | [[Category:Version 7.2]] | |
| − | + | [[Category:Basic Workflows]] | |
| − | + | [[Category:Add-in]] | |
| − | + | [[Category:Standalone]] | |
| − | [[Category:Version | + | [[Category:Chart Properties Form]] |
| − | [[Category: | + | [[Category:OnePager Choices Form]] |
| − | [[Category: | + | |
| − | [[Category: | + | |
| − | [[Category: | + | |
| − | [[Category: | + | |
[[Category:Snapshots]] | [[Category:Snapshots]] | ||
| − | [[Category:Project | + | [[Category:Charts]] |
| − | [[Category: | + | [[Category:Microsoft Project]] |
| − | [[Category:Project | + | [[Category:Microsoft Excel]] |
| + | [[Category:Smartsheet]] | ||
| + | [[Category:Oracle Primavera P6]] | ||
| + | [[Category:Microsoft Project]] | ||
[[Category:OnePager Pro]] | [[Category:OnePager Pro]] | ||
| − | |||
Revision as of 16:32, 31 May 2022
Contents
Overview
The real power of the Pull operation is to let you perform repeated snapshot REPLACE and snapshot ADD operations on an open chart. In other words, the Pull operation’s main purpose is to let you update the on-screen chart as you edit the chart's source plan. Illustrations used in this article are from OnePager Pro using data from Microsoft Project but the feature's function, controls, and manual edits apply equally to other OnePager editions that import from data sources like Microsoft Excel, Smartsheet, and Oracle Primavera P6.
What is a Pull Operation?
A Pull operation starts in the Chart Editor. That is, you already have OnePager running and decide to update the open chart or (rarely) create a new chart. In contrast, a Push operation begins in the OnePager Pro Start from which you use to make a new chart or update an existing chart. We added the Pull operation because we found that OnePager users were often creating a chart and finding something in the source plan that they needed to change. After recognizing the need for a change, they are going back to the source plan, making the change, and then re-launching OnePager to update the chart. The Pull operation lets you open a chart and update it repeatedly as you edit its source plan. After each set of changes to the source plan(s), you can quickly see the effect in the Chart Editor by using the OnePager Data ribbon tool bar tab to Pull the source plan changes into the chart.
For more information on Creating a new chart using the Pull operation, please see the article at: Creating a NEW Chart via Pull Operation Feature 7.13.1-72
For more information on Adding a snapshot using the Pull operation, please see the article at: ADDING a Snapshot via Pull Operation 7.15.1-72
The example below illustrates replacing a snapshot.
Replacing a Snapshot Example
Let’s suppose you have a Microsoft Project source plan with an already created a snapshot for a particular date, say, 8/1/2019. However, on 8/13/2019 you receive new information that updates your Microsoft Project source plan. You now want to update the OnePager chart’s snapshot for 8/13/2019 to reflect the new information. Further, let’s suppose that there are two (2) different charts created form this one Microsoft Project source plan:
- 1) One for the PMO audience created with the Flag20 field and
- 2) The second created for the customer audience created with the Flag10 field.
In this example, we’ll do a replacement for the PMO audience first and then do the same replacement for the customer audience. Since the Microsoft Project source plan was updated and now reflects the latest information for 8/14/2019, we just need to use the Pull operation to access the updated Microsoft Project source plan data and replace the snapshots for the two audiences.
Launching OnePager Pro from Microsoft Project
First, update the Microsoft Project source plan with the updated data you want to replace in the snapshot. Launch OPP from Microsoft Project and when the OnePager Pro Start form appears click the OPEN button which, in our example, provides a dropdown menu with the name of the chart you wish to update by replacement. In this case it’s BlueGrass Project Plan Report - Pro - PMO as shown below:
The OPP Add-in application accesses the selected chart and places it in the Chart Editor. This is the chart and snapshot we want to replace. To proceed with the replacement, click the Data tab on the ribbon. The Chart Editor looks like this:
Use the Microsoft Project Source Plan to Replace a Snapshot
To perform the replacement of the snapshot showing in the Chart Editor, click the Replace Snapshot button on the Data tab as shown below:
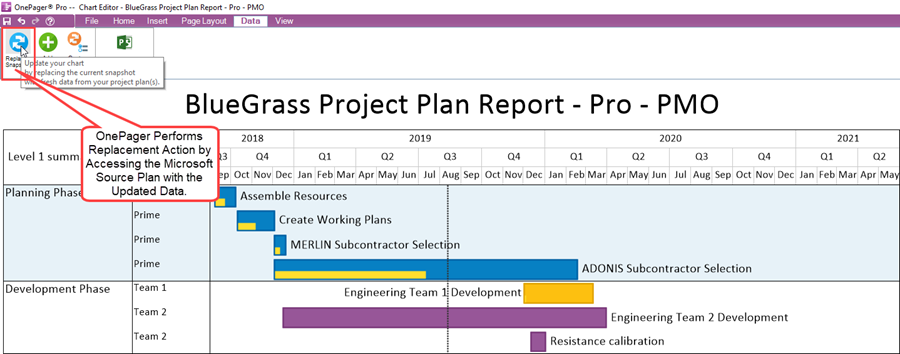
OPP performs this action by accessing the updated Microsoft Project source plan and using these data to update the snapshot as shown above. For a chart with multiple snapshots it is important to make sure that you have selected the correct snapshot to display in the Chart Editor before clicking the Replace Snapshot button. OnePager knows which snapshot is being displayed and replaces the snapshot in the Chart Editor with data from the parent Microsoft Project source plan. Navigating between snapshots in a multiple snapshot chart can be done prior to the above action by using the OnePager View ribbon tool bar tab as shown here:

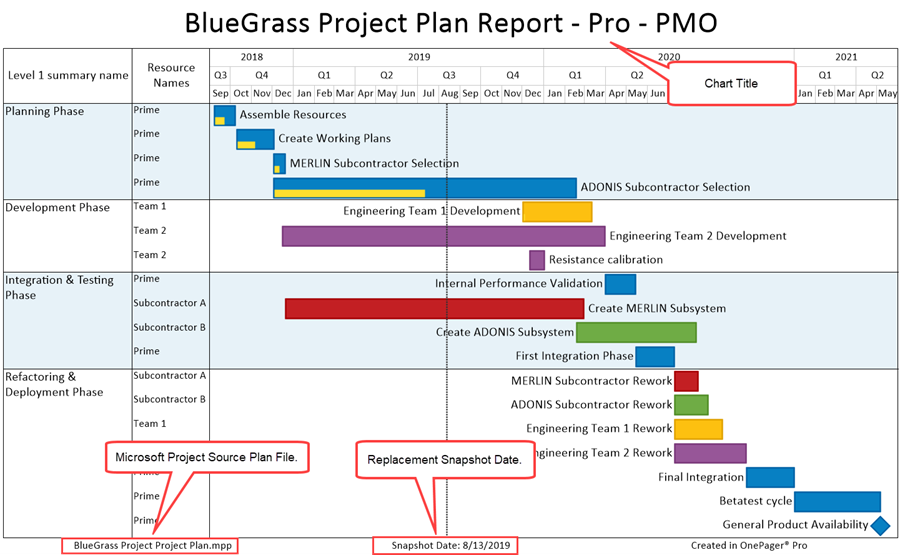
The replaced snapshot for chart BlueGrass Project Plan Report - Pro - PMO is shown below:
Since we are using the OPP Add-in application for this example, it was not necessary to re-launch Microsoft Project. As long as you’ve properly prepared your Microsoft Project source plan that is all that is necessary to utilize the new Pull operation. At this point it is recommended that you save this the chart for access later.
Preparing a Second Chart for Snapshot Replacement
There are two (2) ways of updating the second chart from the same Microsoft Project source plan:
- 1) After saving the first chart, close the OPP Add-in application and repeat the above process by opening the second chart and then using the Flag10 field to select the tasks.
- 2) Remain in the current OPP Add-in Chart Editor and update the second chart from there.
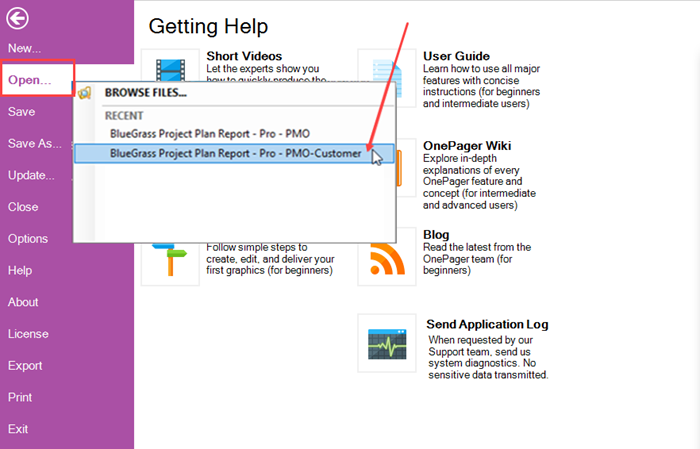
Here we demonstrates the second method as it is more efficient. With the first chart visible in the Chart Editor, click on the File tab on the ribbon and then click the Open… tab on the page that appears. Then, click the chart name for the customer audience as shown below:
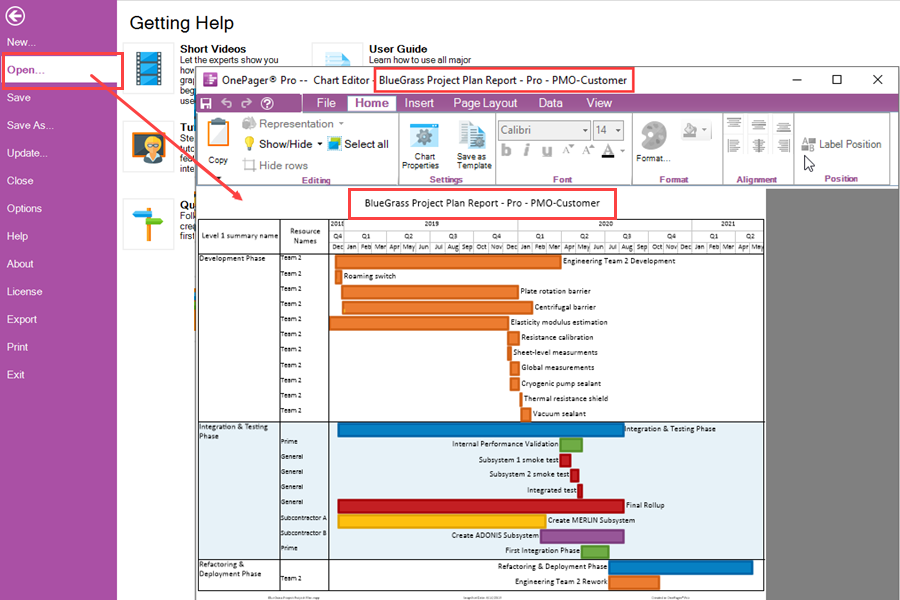
When you click the desired chart name as shown above, OnePager displays that chart in a separate Chart Editor as shown here:
You can expand this Chart Editor window. Now, navigate to the OnePager Data ribbon tool bar tab as shown below:
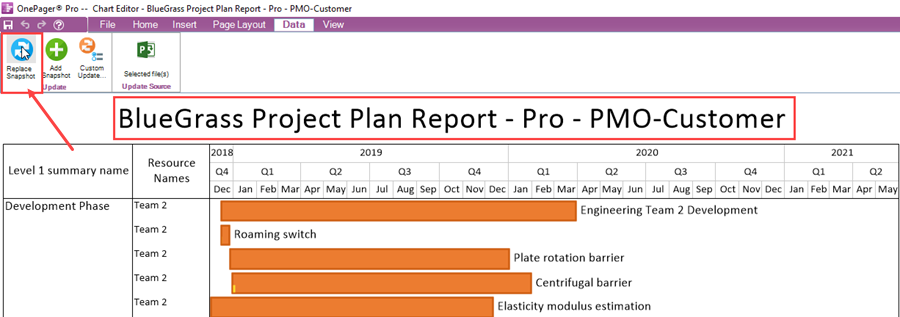
Clicking the Replace Snapshot button on the OnePager Data ribbon tool bar tab tells OPP to go to the parent Microsoft Project source plan for this chart, perform the snapshot replacement under the control of the Flag10 field of the source plan, and display the results in the current Chart Editor. The replaced snapshot is shown below:
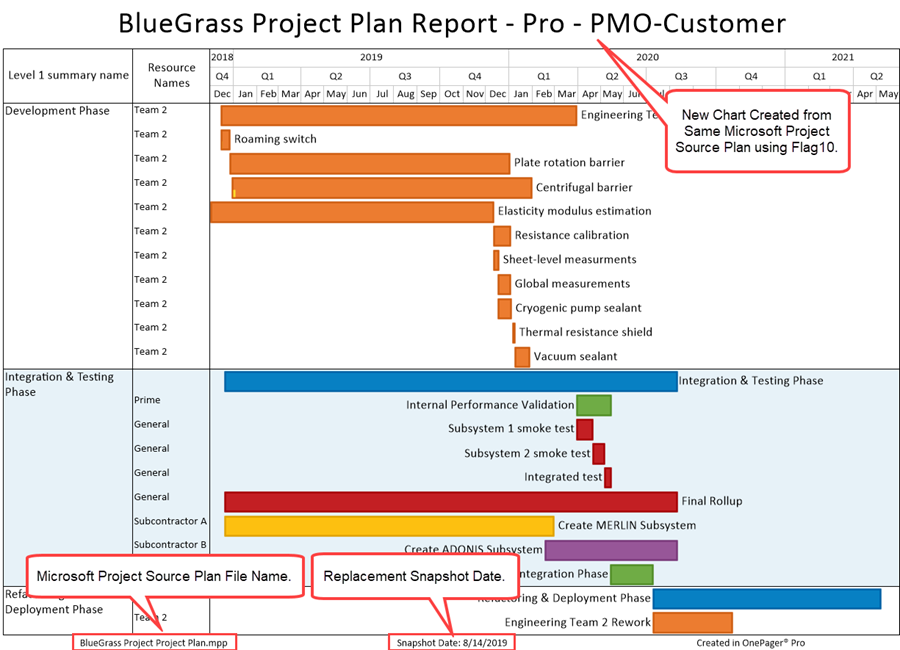
In this example we used the Pull operation twice to update two charts from the same Microsoft Project source plan but using different flag fields. Now that the second chart is created, we recommend that it too be saved for future access.
Compare Results, Edit, Copy to PowerPoint
Once you are satisfied with your charts you can save them, copy them into Microsoft PowerPoint presentations, or share time in other ways. The Pull operation is an easy, fast, and convenient way to create multiple charts which makes you more efficient.
Related Links
Creating a NEW Chart via Pull Operation Feature 7.13.1-72
ADDING a Snapshot via Pull Operation 7.15.1-72
Custom Update (Replacing) of a Snapshot via Pull Operation 7.16.1-72
Using the OnePager "Data" Tab's "Selected file(s)" Button 7.17.1-72
(7.14.1-72)