Difference between revisions of "Managing the Legend in the Chart for Version 7.0"
(→About the Legend) |
(→Showing and Hiding Individual Legend Items) |
||
| Line 86: | Line 86: | ||
<center>[[File:P52-15_1-(4)-06042015.png]]</center> | <center>[[File:P52-15_1-(4)-06042015.png]]</center> | ||
| + | |||
| + | ==Related Links== | ||
| + | |||
| + | [[Conditional Import for Version 7.0 (Portal) | Conditional Import Filters (Portal)]] 7.18.1-70 | ||
(15.1.1-70) | (15.1.1-70) | ||
Revision as of 15:12, 9 October 2019
Contents
About the Legend
1) The capability to use the color dimension in the chart to reflect differences between task/milestone shapes is one of the most significant features of OnePager.
2) The Legend is the displayed component that communicates the meaning of each color to your audience with respect to tasks and milestone shapes in the chart.
3) Accordingly, OnePager provides you total control over the color dimension in your OnePager charts and snapshots through a control structure that begins when the chart is first created and throughout your project as needs change.
4) The "legend can be shown or hidden in the chart as your needs dictate, but a certain amount of thought about the color dimension is recommended before creating your first chart from you Microsoft Project or Excel source plan.
5) If you are already knowledgeable about this subject, you may prefer to skip the next sub-section and continue on at this point: Managing the Legend in the Chart 15.1.1-70
A Discussion On Setting the Color Dimension
6) When you are first creating a chart your first opportunity to address the color dimension is when you select the Microsoft Project or Excel field that is to be used to create task/milestone shape colors in the chart.
- a) This first opportunity is presented in the OnePager choices (OPC) form's second page as shown below:
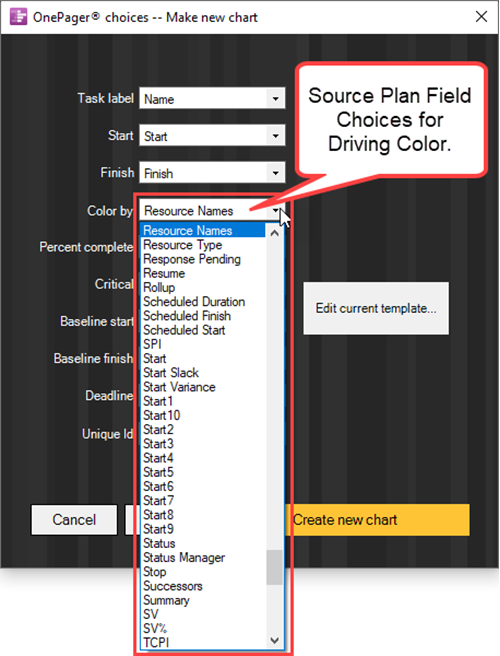
- b) The Color by dropdown contains a list of all source plan fields that OnePager encountered in its initial import of your source plan's data. As a short aside, the Conditional Import Filters feature should be a considered factor as well more about this can be found at this link: Conditional Import Filters (Portal). 7.18.1-70
- c) The initial selection of Resource Names in the illustration above is taken from the current Template form's Task Bars or Milestone tab's Task Bars/Milestone Fill Color control group being used in the process to create the chart as shown here:
- d) Shown in the above illustration, the Color-code based on radio button is selected and the Microsoft Project or Excel field name of Resource Name is selected from the dropdown list.
- e) Selecting another Microsoft Project or Excel field for the Color-code based on window in the Template form also changes the value in the Color by dropdown list of the second page of the OnePager choices (OPC) form also shown above.
- f) Regardless of whether the Template form is updated as described above or you continue to use the original Color-code based on value for the color dimension in the chart, clicking the Create New Chart button at the bottom of the second page of the OPC form produces the first chart in the Chart Editor using the selected Microsoft Project or Excel field to drive the color selection.
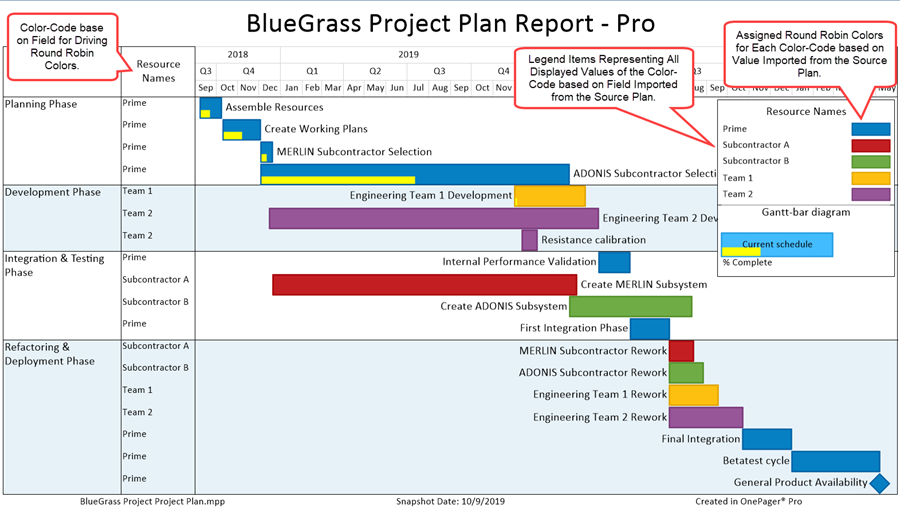
6) As a convenience, OnePager, when creating the first chart uses a round-robin approach to assign specific colors to task/milestone shapes based on their corresponding value found for the Color-code based on field.
7) As the chart is created, colors are selected for each task/milestone shape group with the same value for its Color-code based on field value and that color is assigned to the shape and recorded in the Legend. A typical chart is shown below where the Color-code based on value is Resource Names and the round-robin color assignment scheme is used:
1) Groups of tasks and milestones that share an entry in the legend can have their color and shape modified in one simple operation.
2) This is a fast way of changing several tasks or milestones at once and is an alternative to some of the other methods discussed elsewhere at Manual Editing Task/Milestone Shapes and Text Labels (Portal) 9.0.1-70
3) The following steps show you how to edit, re-position legend items, and reformat the legend:
Showing and Hiding the Legend
1) To hide/unhide the legend, follow the steps described below.
2) Go to the View tab, and locate the Legend checkbox. Uncheck the checkbox to hide the legend, as shown below:

3) To unhide the legend after hiding it, ensure that the Legend checkbox is checked.
Moving and Resizing the Legend
1) To move or resize the legend, follow the steps below.
2) Left clicking anywhere on the legend selects it, as shown below:
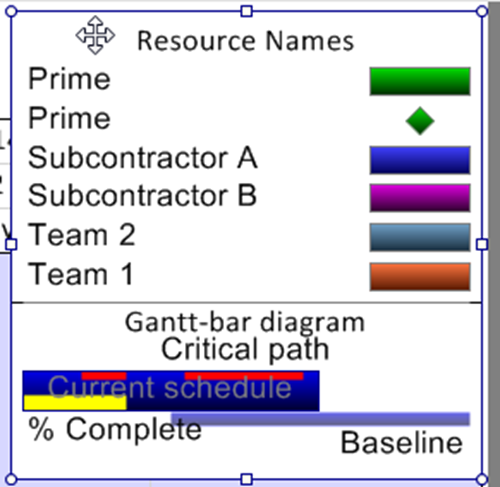
3) After selecting the legend, you can:
- a) Drag the legend to any other location in the document area.
- b) Use the grab boxes to stretch or shrink the legend to the desired size.
Showing and Hiding Individual Legend Items
1) In addition to hiding the entire legend, you can hide individual legend items. This is useful if the legend has duplicate entries and needs to be simplified.
2) To hide a legend item, right click the desired legend item, as shown below:
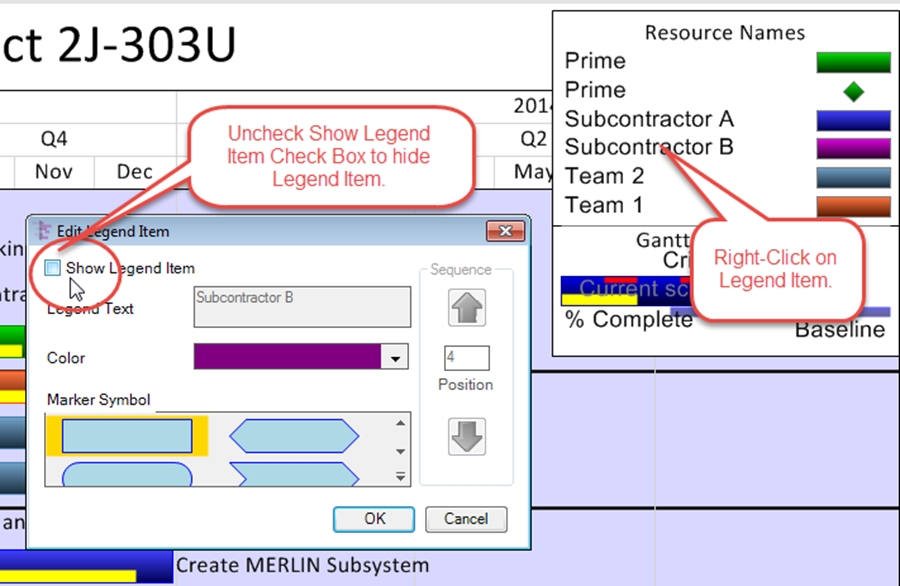
3) Uncheck the Show legend item checkbox.
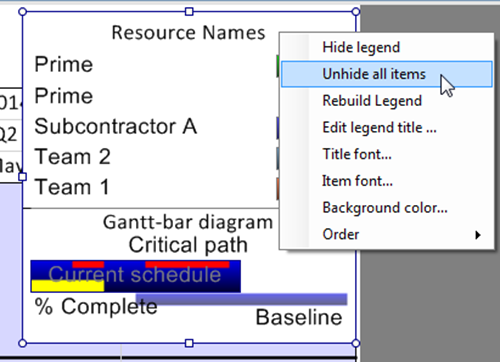
4) Legend items can always be unhidden later. To do so, right click the legend (near the title) and select Unhide all items from the context menu:
Related Links
Conditional Import Filters (Portal) 7.18.1-70
(15.1.1-70)