Difference between revisions of "TEMPxx"
(→Example) |
(→Floating Time Axis Displays and Re-Ordering) |
||
| (372 intermediate revisions by the same user not shown) | |||
| Line 1: | Line 1: | ||
==Overview== | ==Overview== | ||
| − | 1) | + | 1) OnePager Express has the capability to manually '''re-order''' the '''Time Axis Levels''' shown in the chart very easily. |
| − | 2) | + | 2) The '''Time Axis Re-Ordering''' capability is available in the '''Template Properties''' and '''Chart Properties''' form's '''Time Axis''' tab's '''Top, Middle, and Bottom''' sub-tabs. |
| − | + | ===Re-Ordering Example=== | |
| − | + | 3) Given the chart below where the '''Top''', '''Middle''', and '''Bottom Time Axis Levels '''in Year, Quarter, and Month are ordered from '''top''' to '''bottom''', you can '''exchange '''the '''Middle Level''' with the '''Top Level''' by clicking the '''up arrow '''in the '''Re-Order Levels''' control group in the '''Chart Properties ''' form shown below: | |
| − | + | <center>[[File:X70-22_3_6-70-(1)-11182020.png]]</center> | |
| + | <center><X70-22_3_6-70-(1)-11182020.png></center> | ||
| − | |||
| − | + | 4) When you click the '''Apply''' or '''OK '''button in the '''Chart Properties '''form the '''Top''' and '''Middle Levels '''are '''exchanged''' as shown here: | |
| − | + | ||
| − | <center>[[File: | + | <center>[[File:X70-22_3_6-70-(2)-11182020.png]]</center> |
| − | <center> | + | <center><X70-22_3_6-70-(12)-11182020.png></center> |
| − | + | 5) This is a useful shortcut when you want to make the '''exchange''' quickly without going through the process of manually accessing each '''Time Axis Levels '''involved and manually changing the '''Tic unit '''and '''Label format '''setting in each '''Time Axis Level''' participating in the '''exchange'''. | |
| − | == | + | ==Re-Ordering Time Axis Levels == |
| − | + | ===Top and Bottom Time Axis Displays in the Chart=== | |
| − | + | 1) The chart can display '''Time Axis Levels''' at either the '''top''', '''bottom, '''or in both positions in the chart. | |
| − | + | ||
| − | + | 2) This is controlled in the '''Chart Properties '''form at the '''Time Axis '''tab’s '''Calendar '''sub-tab in the '''Formatting & Layout '''control group as shown below: | |
| − | + | ||
| − | + | <center>[[File:X70-22_3_6-70-(3)-11182020.png]]</center> | |
| + | <center><X70-22_3_6-70-(3)-11182020.png></center> | ||
| − | + | 3) Identical controls for '''Time Axis Location''' are provided in the '''Template Properties '''form '''Time Axis '''tab '''Calendar '''sub-tab. | |
| − | + | 4) If the '''Time Axis '''is being '''located''' at both the '''top''' and '''bottom''' of the chart, OnePager Express performs the '''exchange '''automatically for both '''Time Axis '''displays. | |
| − | + | 5) The chart below '''locates''' the '''Time Axis '''at both the '''Top '''and '''Bottom '''of the chart: | |
| − | + | ||
| − | <center>[[File: | + | <center>[[File:X70-22_3_6-70-(4)-11182020.png]]</center> |
| − | <center> | + | <center><X70-22_3_6-70-(4)-11182020.png></center> |
| − | + | 6) If we use the '''Re-Order Levels''' control group in the '''Chart Properties '''form '''Time Axis '''tab’s '''Top Level '''sub-tab to '''exchange '''the '''Top Level '''with the '''Middle Level''', the two '''Time Axis '''displays in the chart above look like this''':''' | |
| − | 5) | + | <center>[[File:X70-22_3_6-70-(5)-11182020.png]]</center> |
| + | <center><X70-22_3_6-70-(5)-11182020.png></center> | ||
| − | + | 7) Comparing the two illustrations above it is shown that the Year and Quarter '''Time Axis Tic Units''' in their respective '''Time Axis Levels''' are '''exchanged'''. | |
| − | + | ||
| − | + | ===Floating Time Axis Displays and Re-Ordering=== | |
| − | + | ||
| − | + | 8) If '''Floating Time Axes '''are '''located''' within the chart and the '''Floating Time Axis Levels''' are consistent with the '''Time Axis Level exchange '''being performed, OnePager Express makes appropriate '''exchanges '''for the '''Floating Time Axes''' as well. | |
| − | + | 9) Using the example above, three '''Floating Time Axes '''can be easily added to the original chart display. | |
| − | + | 10) For illustrative purposes the '''Floating Time Axes '''added to the chart are in '''Top Level '''to '''Bottom Level '''order although the '''Floating Time Axis '''order in the chart is immaterial to the example. | |
| − | + | 11) The sample chart looks like this: | |
| − | : | + | <center>[[File:X70-22_3_6-70-(6-1)-11182020.png]]</center> |
| + | <center><X70-22_3_6-70-(6-1)-11182020.png></center> | ||
| − | + | 12) If we use the '''Re-Order Levels''' control group in the '''Chart Properties '''form '''Time Axis '''tab’s '''Top Level '''sub-tab to again '''exchange '''the '''Top Level '''with the '''Middle Level''', the two '''Time Axis '''displays in the chart above with the '''Floating Time Axes '''look like this: | |
| − | + | ||
| − | <center>[[File: | + | <center>[[File:X70-22_3_6-70-(7-1)-11182020.png]]</center> |
| − | <center> | + | <center><X70-22_3_6-70-(7-1)-11182020.png></center> |
| − | + | 13) Comparing the pair of illustrations above with the '''Floating Time Axes''', it is shown that the Year and Quarter '''Time Axis Tic Units''' in their respective '''Time Axis Levels''' and '''Floating Time Axis Levels '''are '''exchanged'''. | |
| − | + | 14) For more information on the '''Floating Time Axis''', please see the article at: [[The Floating Time Axis Feature for OnePager Express for Version 7.0 | The Floating Time Axis Feature for OnePager Express]]. 22.3.10-70 | |
| − | + | 15) Where the '''Floating Time Axes located''' in the chart do not correspond exactly to those '''Time Axis Levels located '''in the '''Top''' and/or''' Bottom Time Axis locations''', OnePager Express performs the '''Time Axis Level exchange''' if the '''Floating Time Axis '''has at least one of the corresponding '''Time Axis Levels''' as illustrated below. | |
| − | + | ||
| − | + | 16) Suppose the '''Time Axes '''and '''Floating Time Axes '''are configured and '''located '''as shown below where the '''Floating Time Axes '''consist only of Quarters and Months: | |
| − | + | ||
| − | : | + | <center>[[File:X70-22_3_6-70-(8)-11182020.png]]</center> |
| + | <center><X70-22_3_6-70-(8)-11182020.png></center> | ||
| − | + | 17) Performing the '''Time Axis Level re-ordering''' used in the previous examples (i.e., '''Exchanging '''the '''Top Time Axis Level '''with the '''Middle Time Axis Level'''), produces this result in the chart: | |
| − | + | <center>[[File:X70-22_3_6-70-(9)-11182020.png]]</center> | |
| + | <center><X70-22_3_6-70-(9)-11182020.png></center> | ||
| − | + | 18) The result above is that the '''Floating Time Axis Top Level '''is '''exchanged '''with the '''Floating Time Axis Middle Level''' as expected. | |
| − | + | 19) However, since only the '''Middle '''and '''Bottom Floating Time Axes''' were inserted into the chart, the '''exchange''' only shows the Year replacing the Quarters in the '''Floating Time Axis location'''. | |
| − | + | 20) Since there can be several single or sets of '''Floating Time Axes located''' in the chart, '''exchanges''' of '''Levels''' are consistent depending on the '''Levels''' incorporated into the displayed '''Floating Time Axes'''. | |
| − | [[ | + | 21) For more information on the '''Floating Time Axis''', please see the article at: [[The Floating Time Axis Feature for OnePager Express for Version 7.0 | The Floating Time Axis Feature for OnePager Express]]. 22.3.10-70 |
| − | + | ==Other Related Features== | |
| − | + | ===Re-Ordering Time Axis Levels in the Template Form=== | |
| − | + | 1) The '''Re-Order Levels''' control group shown in the '''Chart Properties '''form examples above is also available in the '''Template Properties '''form at the '''Time Axis '''tab’s '''Top''', '''Middle''', and '''Bottom Time Axis Levels''': | |
| − | [[ | + | <center>[[File:X70-22_3_6-70-(10)-11182020.png]]</center> |
| + | <center><X70-22_3_6-70-(10)-11182020.png></center> | ||
| − | + | 2) Making '''exchanges''' in the '''Template Properties '''form applies these '''exchanges''' to any '''Chart Properties '''and chart created with the modified '''Template Properties '''form. | |
| − | + | 3) It is important to remember when making '''edits''' to the '''Template Properties '''form that the form must be '''saved''' before it can be used successfully to create a chart and/or snapshots with the '''Template Properties '''form’s '''edits applied'''. | |
| − | + | 4) For more information on the '''Template Properties '''form, please see the article at: [[Managing Templates for Version 7.0 (Portal) | Managing Templates (Portal)]]. 24.0.1-70 | |
| − | + | ===Re-Ordering Time Axis Levels in Chart Properties Forms Converted into Template Forms=== | |
| − | + | 5) Conversely, if any '''Chart Properties '''form with '''exchanged Time Axis Levels '''is made into a '''Template Properties '''form and '''saved''', subsequent use of the '''saved''' '''Template Properties '''form utilizes the '''exchanged Time Axis Levels '''in charts and snapshots produced under the modified '''Template Properties '''form. | |
| − | (11. | + | <center>[[File:X70-22_3_6-70-(11)-11182020.png]]</center> |
| + | <center><X70-22_3_6-70-(11)-11182020.png></center> | ||
| + | |||
| + | 6) For more information on '''Making a template from a chart''', please see this section in the article at: [[Managing the Current Template for Version 7.0#Making a Template from a Chart | Managing the Current Template - Making a Template from a Chart]]. 24.6.1-70 | ||
| + | |||
| + | ==Related Links== | ||
| + | |||
| + | [[The Floating Time Axis Feature for OnePager Express for Version 7.0 | The Floating Time Axis Feature for OnePager Express]] 22.3.10-70 | ||
| + | |||
| + | [[Managing Templates for Version 7.0 (Portal) | Managing Templates (Portal)]] 24.0.1-70 | ||
| + | |||
| + | [[Managing the Current Template for Version 7.0 | Managing the Current Template]] 24.6.1-70 | ||
| + | |||
| + | (22.3.6-70) | ||
[[Category:Version 7.0]] | [[Category:Version 7.0]] | ||
| − | [[Category: | + | [[Category:OnePager Express]] |
| − | + | ||
| − | + | ||
| − | + | ||
[[Category:Editing the Chart]] | [[Category:Editing the Chart]] | ||
| − | [[Category: | + | [[Category:Charts]] |
| − | [[Category: | + | [[Category:Time Axis]] |
| + | [[Category:Time Axis Tab]] | ||
| + | [[Category:Floating Time Axis]] | ||
[[Category:Color Palettes]] | [[Category:Color Palettes]] | ||
| − | [[Category: | + | [[Category:Snapshots]] |
| − | [[Category: | + | [[Category:Template]] |
| − | [[Category: | + | [[Category:Chart Properties]] |
Latest revision as of 19:39, 19 November 2020
Overview
1) OnePager Express has the capability to manually re-order the Time Axis Levels shown in the chart very easily.
2) The Time Axis Re-Ordering capability is available in the Template Properties and Chart Properties form's Time Axis tab's Top, Middle, and Bottom sub-tabs.
Re-Ordering Example
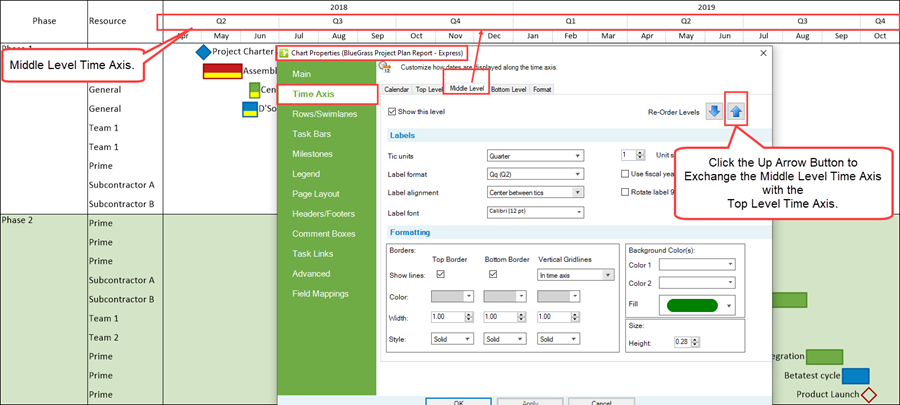
3) Given the chart below where the Top, Middle, and Bottom Time Axis Levels in Year, Quarter, and Month are ordered from top to bottom, you can exchange the Middle Level with the Top Level by clicking the up arrow in the Re-Order Levels control group in the Chart Properties form shown below:
4) When you click the Apply or OK button in the Chart Properties form the Top and Middle Levels are exchanged as shown here:
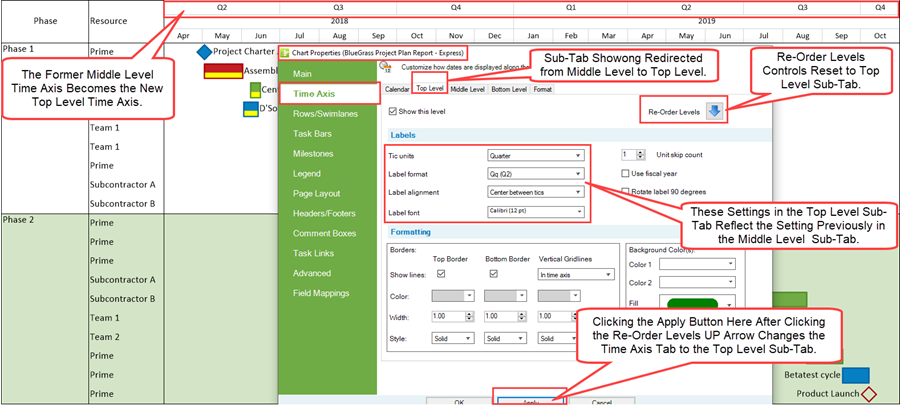
5) This is a useful shortcut when you want to make the exchange quickly without going through the process of manually accessing each Time Axis Levels involved and manually changing the Tic unit and Label format setting in each Time Axis Level participating in the exchange.
Re-Ordering Time Axis Levels
Top and Bottom Time Axis Displays in the Chart
1) The chart can display Time Axis Levels at either the top, bottom, or in both positions in the chart.
2) This is controlled in the Chart Properties form at the Time Axis tab’s Calendar sub-tab in the Formatting & Layout control group as shown below:
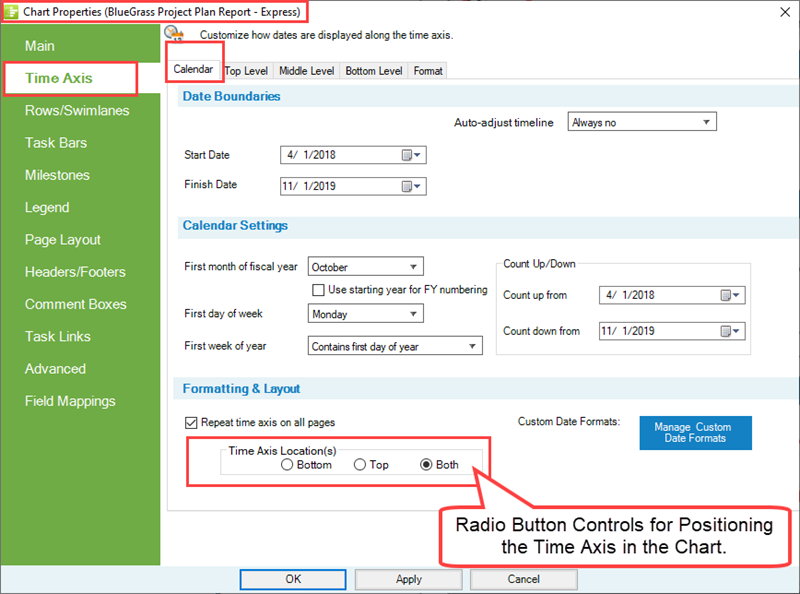
3) Identical controls for Time Axis Location are provided in the Template Properties form Time Axis tab Calendar sub-tab.
4) If the Time Axis is being located at both the top and bottom of the chart, OnePager Express performs the exchange automatically for both Time Axis displays.
5) The chart below locates the Time Axis at both the Top and Bottom of the chart:
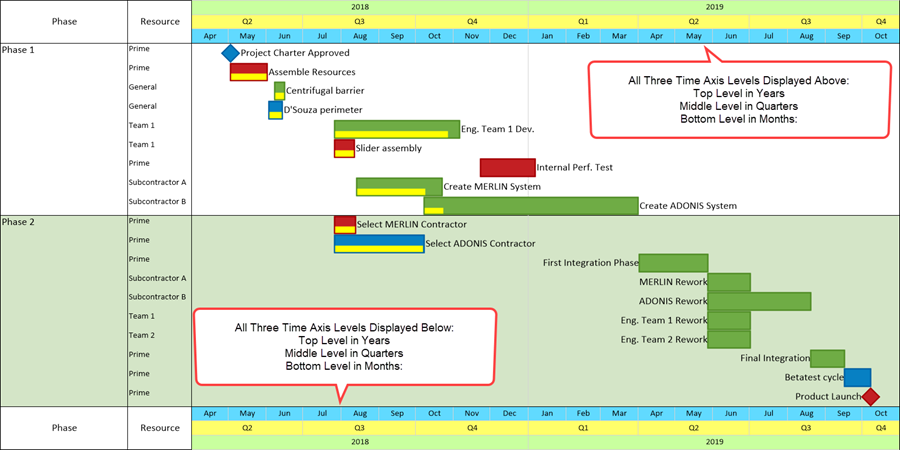
6) If we use the Re-Order Levels control group in the Chart Properties form Time Axis tab’s Top Level sub-tab to exchange the Top Level with the Middle Level, the two Time Axis displays in the chart above look like this:
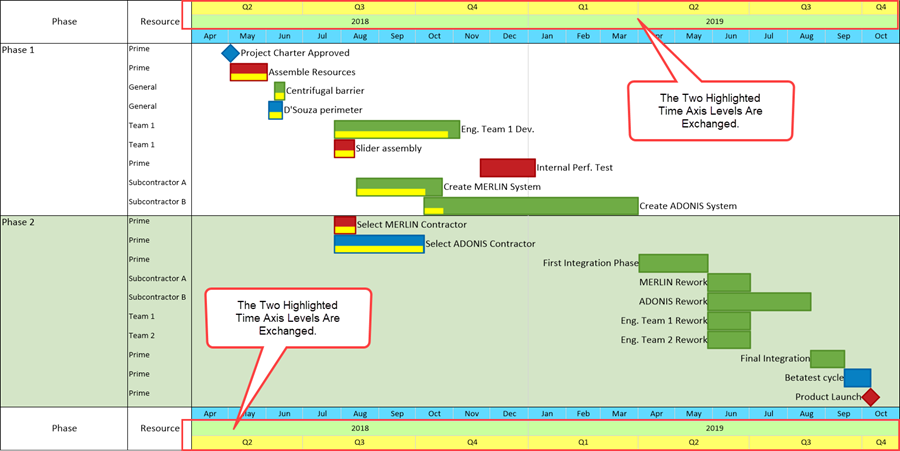
7) Comparing the two illustrations above it is shown that the Year and Quarter Time Axis Tic Units in their respective Time Axis Levels are exchanged.
Floating Time Axis Displays and Re-Ordering
8) If Floating Time Axes are located within the chart and the Floating Time Axis Levels are consistent with the Time Axis Level exchange being performed, OnePager Express makes appropriate exchanges for the Floating Time Axes as well.
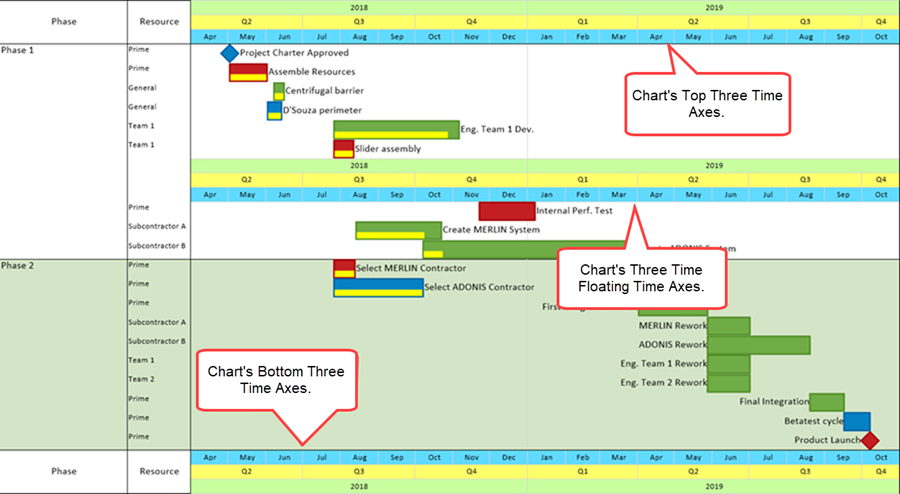
9) Using the example above, three Floating Time Axes can be easily added to the original chart display.
10) For illustrative purposes the Floating Time Axes added to the chart are in Top Level to Bottom Level order although the Floating Time Axis order in the chart is immaterial to the example.
11) The sample chart looks like this:
12) If we use the Re-Order Levels control group in the Chart Properties form Time Axis tab’s Top Level sub-tab to again exchange the Top Level with the Middle Level, the two Time Axis displays in the chart above with the Floating Time Axes look like this:
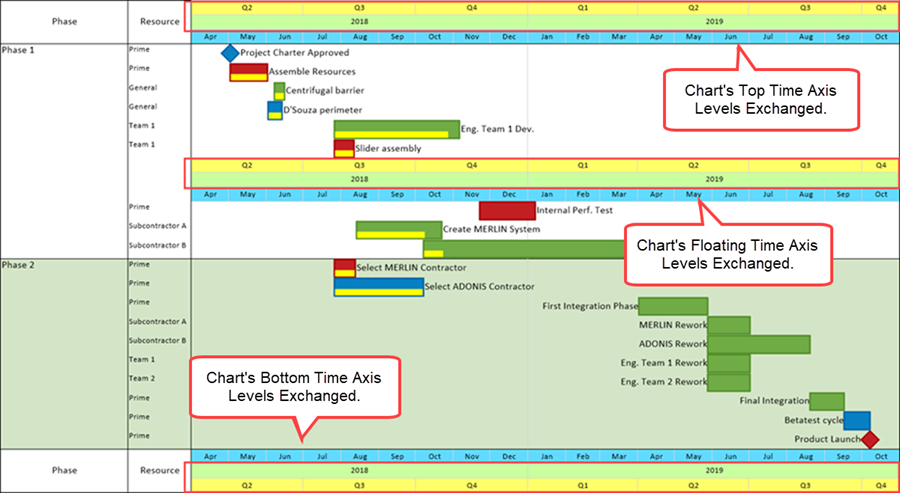
13) Comparing the pair of illustrations above with the Floating Time Axes, it is shown that the Year and Quarter Time Axis Tic Units in their respective Time Axis Levels and Floating Time Axis Levels are exchanged.
14) For more information on the Floating Time Axis, please see the article at: The Floating Time Axis Feature for OnePager Express. 22.3.10-70
15) Where the Floating Time Axes located in the chart do not correspond exactly to those Time Axis Levels located in the Top and/or Bottom Time Axis locations, OnePager Express performs the Time Axis Level exchange if the Floating Time Axis has at least one of the corresponding Time Axis Levels as illustrated below.
16) Suppose the Time Axes and Floating Time Axes are configured and located as shown below where the Floating Time Axes consist only of Quarters and Months:
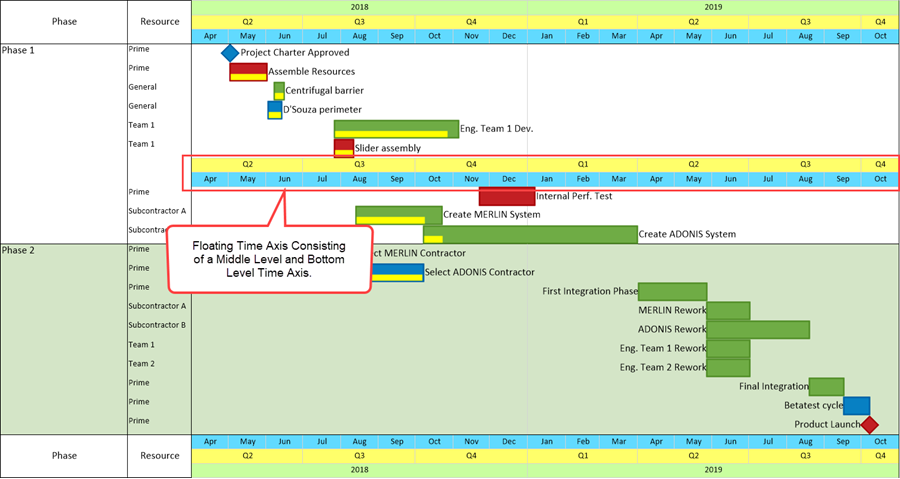
17) Performing the Time Axis Level re-ordering used in the previous examples (i.e., Exchanging the Top Time Axis Level with the Middle Time Axis Level), produces this result in the chart:
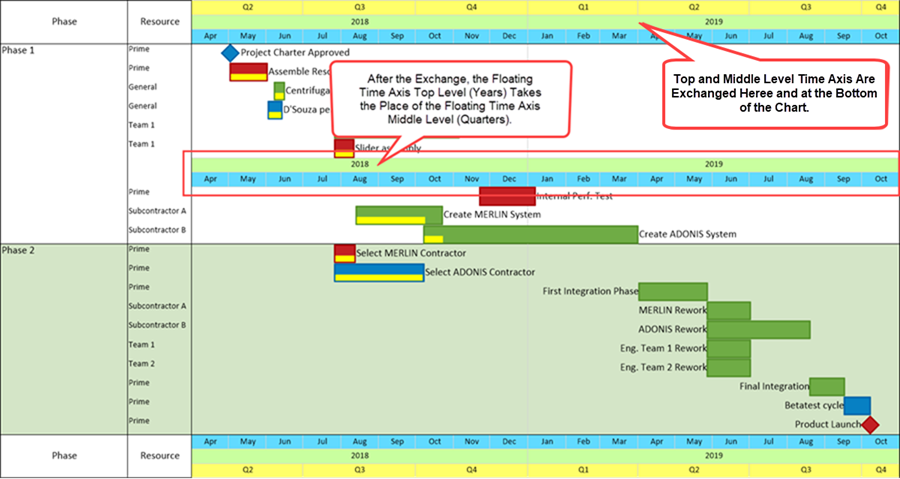
18) The result above is that the Floating Time Axis Top Level is exchanged with the Floating Time Axis Middle Level as expected.
19) However, since only the Middle and Bottom Floating Time Axes were inserted into the chart, the exchange only shows the Year replacing the Quarters in the Floating Time Axis location.
20) Since there can be several single or sets of Floating Time Axes located in the chart, exchanges of Levels are consistent depending on the Levels incorporated into the displayed Floating Time Axes.
21) For more information on the Floating Time Axis, please see the article at: The Floating Time Axis Feature for OnePager Express. 22.3.10-70
Other Related Features
Re-Ordering Time Axis Levels in the Template Form
1) The Re-Order Levels control group shown in the Chart Properties form examples above is also available in the Template Properties form at the Time Axis tab’s Top, Middle, and Bottom Time Axis Levels:
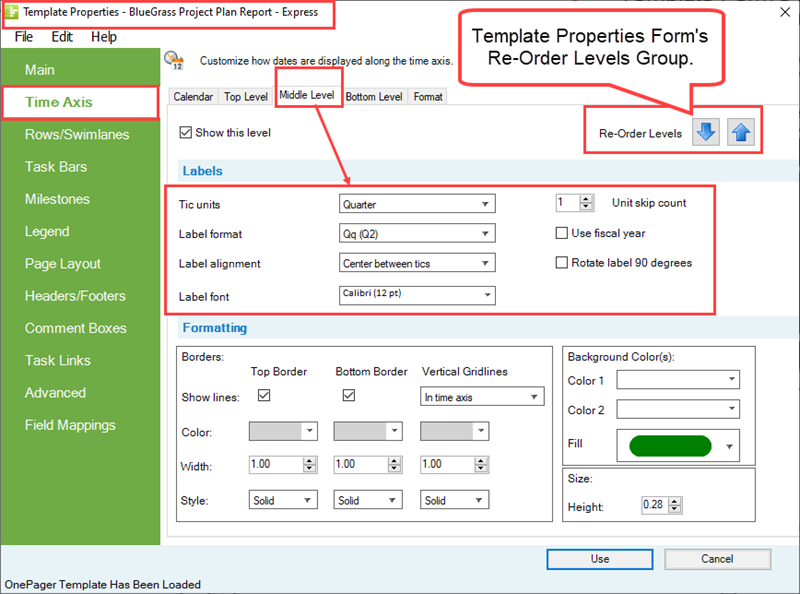
2) Making exchanges in the Template Properties form applies these exchanges to any Chart Properties and chart created with the modified Template Properties form.
3) It is important to remember when making edits to the Template Properties form that the form must be saved before it can be used successfully to create a chart and/or snapshots with the Template Properties form’s edits applied.
4) For more information on the Template Properties form, please see the article at: Managing Templates (Portal). 24.0.1-70
Re-Ordering Time Axis Levels in Chart Properties Forms Converted into Template Forms
5) Conversely, if any Chart Properties form with exchanged Time Axis Levels is made into a Template Properties form and saved, subsequent use of the saved Template Properties form utilizes the exchanged Time Axis Levels in charts and snapshots produced under the modified Template Properties form.
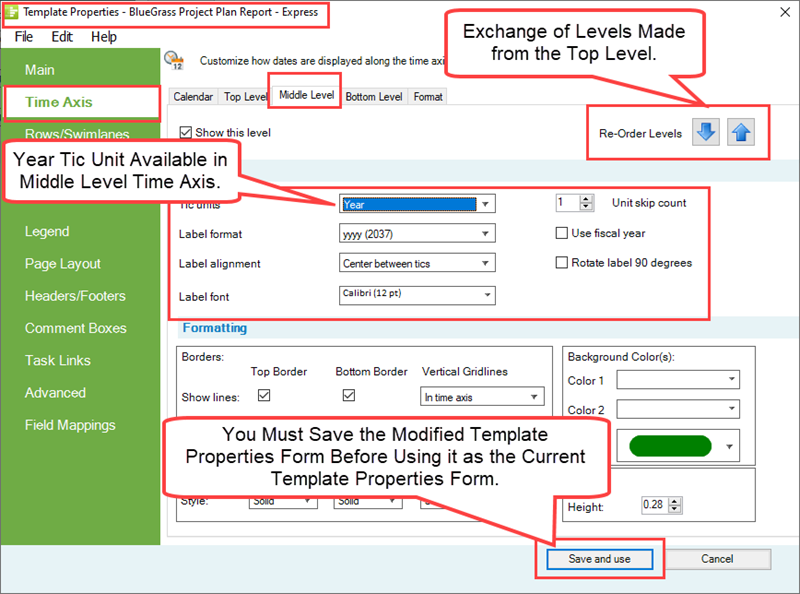
6) For more information on Making a template from a chart, please see this section in the article at: Managing the Current Template - Making a Template from a Chart. 24.6.1-70
Related Links
The Floating Time Axis Feature for OnePager Express 22.3.10-70
Managing Templates (Portal) 24.0.1-70
Managing the Current Template 24.6.1-70
(22.3.6-70)