Difference between revisions of "Testing Article1"

From OnePager Documentation
Jump to: navigation, search
(Preparation for Making a Multi-Project Chart from Separate Smartsheet Source Plans)
(Split Resources in the Chart)
 
(307 intermediate revisions by the same user not shown)
Line 1: Line 1:
==Overview==
+
==Introduction==
  
One of the strength of OnePager is its ability to create compact visual representations of '''multiple projects''' that are part of a '''single''' Smartsheet file as well as create OnePager charts from '''multiple single''' Smartsheet files. These can be several projects that belong to one program or they can be several projects and programs in an organization’s portfolio. Representing '''multiple projects''' originating in a single Smartsheet '''source plan''' can, therefore, be easily done with the creative selection of '''Row and Swimlane''' fields from the Smartsheet '''source plan'''.
+
This article is focused on using the ''' Column Splitting''' feature with OnePager Bundle '''Standalone''' and '''imported''' Asana '''source plans'''.
  
The OnePager Bundle '''Standalone''' application can '''import''' these '''multi-project '''Smartsheet files and produce '''multi-project charts'''.
+
==About Splitting and Parsing Fields==
  
Additionally, OnePager Bundle '''Standalone''' has the capability to '''build multi-project charts '''from individual Smartsheet '''exported''' files.
+
The OnePager '''column splitting''' feature allows you to '''duplicate task bars''' when a task in your Asana '''source plan''' is assigned to '''multiple resources''' (or anything else).  Because assignments from Asana often are '''comma-delimited''', this feature enables OnePager to '''parse the comma-delimited list''' and '''create a unique task bar''' for each instance in the '''comma-separated''' list.
  
==Creating a Multi-Project Chart from a Multi-Project Smartsheet Source Plan File==
+
===Split Resource Names Example===
  
One method for using a '''single''' Smartsheet file is to add a field to your '''source plan''' with a field name of '''Project'''.  This name is recognized by OnePager Bundle ('''OPB''') '''Standalone''' and is utilized in '''OPB''' multi-project '''Template Properties''' form shipped with the product.  An example Smartsheet '''source plan''' with the '''Project''' field is shown below:
+
Say you want to use '''color-codes''' on task bars/milestone symbols based upon your Asana '''source plan’s Assigned to''' column as shown below:
  
<center>[[File:P71-8_5_3-71-(1)-11303031.png]]</center>
+
<center>[[File:P72-24_5_3-72-(1)-11022023.png]]</center>
<center>P71-8_5_3-71-(1)-11303031.png</center>
+
<center>P72-24_5_3-72-(1)-11022023.png</center>
  
After configuring your Smartsheet '''source plan''' with the '''Project''' field and the necessary '''multi-project''' schedule data, you can create a useful '''multi-project''' chart by following the steps described in the next section.
+
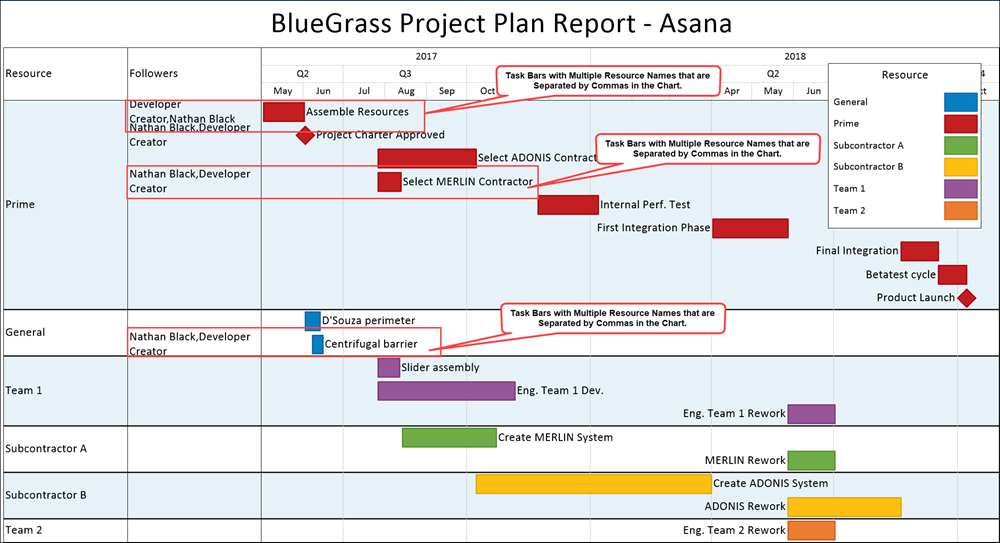
Some of the entries in the '''Assigned to''' column consist of multiple, '''comma-separated''' items and some tasks only used one '''resource'''.  Without the '''column splitting''' feature, a chart '''created''' from these data and assigned task bar/milestone symbol '''colors''' based upon the '''Assigned to''' column looks like this:
  
Launch '''OPB Standalone''' and '''connect''' to your Smartsheet account. Select the '''NEW''' option on the '''OnePager Bundle Start''' form and '''select''' the Smartsheet '''multi-project file''' shown here:
+
<center>[[File:P72-24_5_3-72-(5)-11272023.png]]</center>
 +
<center>P72-24_5_3-72-(5)-11272023.png</center>
  
<center>[[File:P71-7_2_3-71-(2)-11152021.png]]</center>
+
OnePager, in this case, treats the '''entire string''' as an individual '''Assigned to''' value. To provide more flexibility in displaying task bars that have '''multiple resources''' assigned, OnePager supports the concept of a '''column splitting'''.  This feature recognizes '''comma-separated''' values in a '''designated column''' and '''creates a separate task bar''' for each of the '''comma-separated''' values.
<center>P71-7_2_3-71-(2)-11152021.png</center>
+
  
===Creating a NEW Chart from a Multi-Project Source Plan===
+
===Enabling Splitting===
  
Next, click the '''NEW''' button on the '''OnePager Bundle Start''' form.  This accesses the '''OnePager choices''' ('''OPC''') form where clicking the '''Select''' command in the '''Please select a source file'''' sub-control group enables you to '''BROWSE Smartsheet ...''' files or to select a '''RECENT''' file as shown here:
+
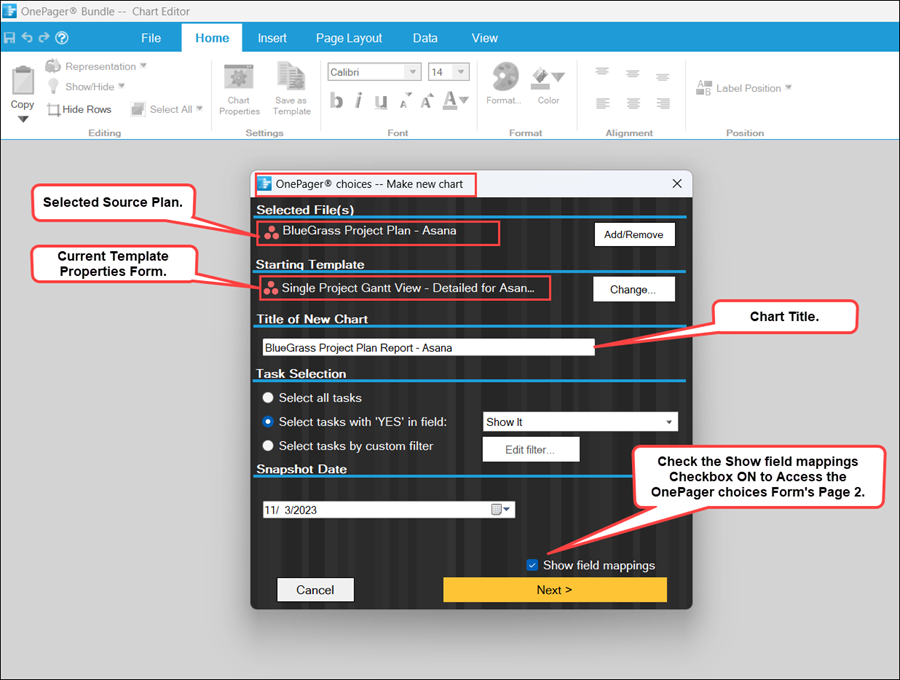
To use this feature requires turning '''ON''' the feature in the Asana '''Template Properties''' form you intend to use to make the chartThe setting must be turned '''ON''' before the chart is created so launch OnePager Bundle from the '''desktop icon''', click the '''NEW''' button on the '''OnePager Bundle Start''' form to access the '''OnePager choices''' form, '''select''' your Asana '''source plan''', and type in the chart's '''title''' as shown here:
  
<center>[[File:P71-8_5_3-71-(3)-11303031.png]]</center>
+
<center>[[File:P72-24_5_3-72-(2A)-11022023.png]]</center>
<center>P71-8_5_3-71-(3)-11303031.png</center>
+
<center>P72-24_5_3-72-(2A)-11022023.png</center>
  
For this illustration, we'll select the '''source plan''' named '''BlueGrass Excel Project Plan-Bundle (on Smartsheet)'''.  When we do this, the '''OPC''' form is expanded to look like this:
+
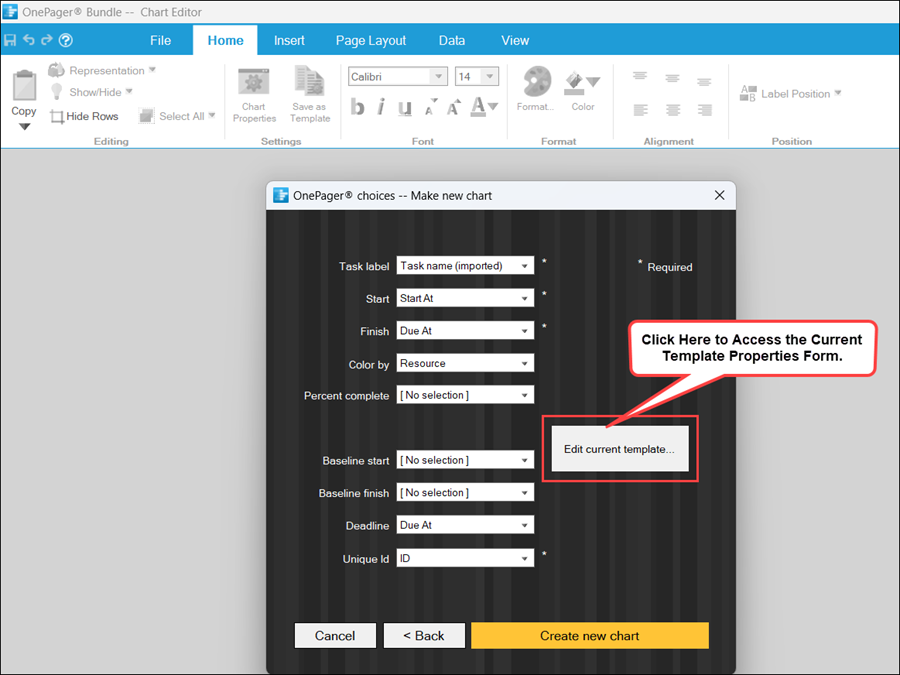
When you click the '''Next>''' button at the bottom of the form, OnePager accesses the second page of the '''OnePager choices''' form shown below:
  
<center>[[File:P71-8_5_3-71-(3A-1)-11303031.png]]</center>
+
<center>[[File:P72-24_5_3-72-(2AA)-11022023.png]]</center>
<center>P71-8_5_3-71-(3A-1)-11303031.png</center>
+
<center>P72-24_5_3-72-(2AA)-11022023.png</center>
  
Before creating the '''NEW multi-project''' chart we must change the '''Template Properties''' form to support the creation of a chart from a '''multi-project source plan''' as described below.
+
Clicking the '''Edit current template''' button accesses the current '''Template Properties''' form.  Navigate to the '''Field Mappings''' tab on the form, check the '''Enable splitting on:''' checkbox to '''ON''' and (in this example) select the '''Assigned To''' column from the dropdown list provided. The results are shown here:
  
===Setting up the OnePager Bundle Template Properties Form for a Multi-Project Chart===
+
<center>[[File:P72-24_5_3-72-(2AAA)-11022023.png]]</center>
 +
<center>P72-24_5_3-72-(2AAA)-11022023.png</center>
  
As shown above, the '''OnePager choices''' ('''OPC''') form does not show that a '''multi-project Template Properties''' form is being used.  Before proceeding further we must change the '''Template Properties''' form's setting so that a '''multi-project Template Properties''' form is used to create the chart. This is done by clicking the '''Change''' button in the '''Starting Template''' group of the form as shown below:
+
Click the '''Save and use''' button to complete the process and close the current '''Template Properties''' form returning you to the second page of the '''OnePager choices''' form show above.
  
<center>[[File:P71-8_5_3-71-(3B)-11303031.png]]</center>
+
===Split Resources in the Chart===
<center>P71-8_5_3-71-(3B)-11303031.png</center>
+
  
Clicking the '''Change''' button accesses the folder where OnePager Bundle stores Smartsheet '''Template Properties''' forms distributed with the product as shown above. Select the '''Multi-Project Gantt Chart - Detailed''' entry in the window shown above and click the '''Open''' button at the bottom of the form. When you click the '''Open''' button on the '''Open''' form shown above, OnePager changes the current '''Template Properties''' form to the '''Multi-Project Gantt Chart – Detailed Template'''.
+
Clicking the '''Create new chart''' button completes the process and creates the chart with the '''column splitting''' feature in use. The chart with '''splitting''' looks like this:
  
After changing the '''Template Properties''' selection, type in the '''title of the chart''' and assure that the '''Task Selection''' sub-control group's controls are set to '''import''' the tasks you need for your chart.
+
<center>[[File:P72-24_5_3-72-(2)-11022023.png]]</center>
 +
<center>P72-24_5_3-72-(2)-11022023.png</center>
  
===Use the Smartsheet Source Plan to Create the Chart===
+
In the chart with '''column splitting''' shown above, there are now several more task bars in the '''Chart Editor''' than there were before.  The task bar for '''Plate Movement''' is now '''split into two (2) separate task bars''', one for each of the '''two resources assigned'''.  The task bar for '''Centrifugal Barrier''' is now '''split into three (3) separate task bars''', one for each of the '''three resources''' that were assigned to this task in the Asana '''source plan'''.  Each of the '''resources''' has a unique '''color''' assigned.  Each of the '''resources''' appears by itself in the '''Legend'''.  The '''Legend title''' shows the '''column name''' that is used for '''splitting the columns'''.
  
You are now ready to create the multi-project chart.  First, click the '''Next>''' button (shown above) which takes you to the second page of the '''OPC''' form shown below:
+
With this feature, you can use '''column splitting''' just like any other column by using the dropdowns in the '''Template Properties''' form or '''Chart Properties''' form to assign '''colors, highlight task bars and milestone symbols, and to define and label rows and swimlanes'''.
  
<center>[[File:P71-8_5_3-71-(4-1)-11303031.png]]</center>
+
==Splitting Resources and Task Links==
<center>P71-8_5_3-71-(4-1)-11303031.png</center>
+
  
Next, check your '''field mapping settings''' or make any '''Template Properties''' form adjustments.  When you are finished, click the '''Create new chart''' button on the second page. OnePager generates a '''multi-project''' chart that looks like this:
+
When task bars with '''Data-Driven''' or manual '''Task Links''' are '''split''', the '''Task Links''' ('''Data-Driven''' and manual) are '''not shown'''.  Further, the '''Task Links''' that are now '''hidden''' and '''do not''' have entries in the '''Where are My Links?''' form.
  
<center>[[File:P71-8_5_3-71-(5)-11303031.png]]</center>
+
==Related Links==
<center>P71-8_5_3-71-(5)-11303031.png</center>
+
  
The chart above represents two separate projects using the swimlanes to organize the tasks/milestones for each project grouping. As the projects progress and additional projects are added, the additional swimlanes with their corresponding rows are added to the chart in future snapshots.
 
 
===Updating Charts Created from Multiple Projects in a Single Smartsheet Source Plan===
 
 
Eventually you want to '''update''' your '''multi-project''' chart by either '''adding''' a snapshot or '''replacing''' a snapshot.  To perform either the '''add''' or the '''replace''' snapshot, the processes described in these two referenced article references that follow can be used.
 
 
<center>
 
 
{| class="wikitable"
 
{| class="wikitable"
| [[REPLACING a Snapshot via Pull Operation for Version 7.1 | REPLACING a Snapshot via Pull Operation]] 7.14.1-71
+
| [[Templates versus Charts for Version 7.2 | Templates versus Charts]] 4.0.1.3-72
 +
| [[Linking Task and Milestones Using Manual and Data-Driven Task Links for Version 7.2 | Linking Task and Milestone Using Manual and Data-Driven Task Links (Portal)]] 19.0.1-72
 
|-
 
|-
| [[ADDING a Snapshot via Pull Operation for Version 7.1 | ADDING a Snapshot via Pull Operation]] 7.15.1-71
+
| [[Editing with the Chart Properties form for Version 7.2 (Portal) | Editing with the Chart Properties form (Portal)]] 21.0.1-72
|}
+
| [[Template Only Features for OnePager Pro for Version 7.2 | Template Only Features for OnePager Pro]] 24.1.1-72
</center>
+
 
+
The key to making '''updates''' to '''multi-project''' charts from '''multiple-projects''' contained in a '''single''' Smartsheet '''source plan''' is the proper management of the Smartsheet '''source plan''' data in the '''source packet'''.  Recall that the '''source packet''' contains the file or files that are to be used to either '''create''' or '''update''' a chart.  They are stored as '''file names and path names''' in the chart’s '''.TAM''' file, and can be accessed from the OnePager '''Data''' ribbon tool bar tab’s '''Selected file(s)''' button on the ribbon as shown below:
+
 
+
<center>[[File:P71-8_5_3-71-(6)-11303031.png]]</center>
+
<center>P71-8_5_3-71-(6)-11303031.png</center>
+
 
+
Validating the contents of the '''source packet''' and assuring that these are the Smartsheet '''source plans''' that were '''updated''' is an essential step before proceeding to perform a chart '''update'''.
+
 
+
==Creating a Multi-Project Chart from Individual Single-Project Smartsheet Source Plan Files==
+
 
+
===Introduction===
+
 
+
Suppose you have '''multiple''' Smartsheet '''source plans''' that are related and you want to create a '''single''' chart that shows the important schedule items.  You can do this as long as the related Smartsheet '''source plans''' are constructed with unique '''Task ID''' field contents. This means that you must adjust the '''Task ID''' column in the '''multiple''' Smartsheet '''source plans''' such that each row has a unique number or identifier in the '''Task ID''' field. This is necessary because unlike Microsoft Project, Smartsheet does not automatically provide a '''unique identifier''' for rows.  Additionally, unique '''Task ID''' numbers are needed so that OnePager Bundle ('''OPB''') does not get rows confused when performing snapshot updates.
+
 
+
For more information on '''Task ID's''', please see the section in the article at: [[Merging the Wrong Tasks into a Chart for Version 7.1 - OnePager Bundle - Smartsheet#Smartsheet ObjectID Field | Smartsheet ObjectID Field]] 7.21.1-71
+
 
+
===Preparation for Making a Multi-Project Chart from Separate Smartsheet Source Plans===
+
 
+
To illustrate what is needed, let’s construct a '''multi-project''' chart from the '''BlueGrass Project Plan''' Smartsheet '''source plan''' by splitting this '''source plan''' into two distinct files as shown below:
+
 
+
<center>'''Merlin Project Phases 1 and 2'''</center>
+
 
+
<center>[[File:P71-8_5_3-71-(7)-12012021.png]]</center>
+
<center>P71-8_5_3-71-(7)-12012021.png</center>
+
 
+
<center>'''Adonis Project Phases 1 and 2'''</center>
+
 
+
<center>[[File:P71-8_5_3-71-(8)-12012021.png]]</center>
+
<center>P71-8_5_3-71-(8)-12012021.png</center>
+
 
+
====Important Note====
+
 
+
Each of the Smartsheet '''source plans''' above have unique '''Task ID''' fields with '''unique numbers'''.  It is important throughout the use of these Smartsheet '''source plans''' that these assigned unique '''Task ID''' numbers remain with their respective tasks.  '''Dates''' can change in the Smartsheet '''source plan's''' rows along with other '''updated''' information as the projects progress, but the '''Task ID''' number '''must''' remain associated with the task activity.  Tasks can be '''deleted''', but the '''deleted Task ID''' should not be '''reused''' for a later snapshot.  '''OPB''' can process out of sequence '''Task ID''' numbers.
+
 
+
===Setting up the One Pager Bundle Template Properties Form for a Multi-Project Chart===
+
 
+
The next step is to select and '''update''' an appropriate '''OPB Template Properties''' form
+
 
+
For this illustration we’ve selected the '''Multi-Project Gantt Chart – Detailed Template Properties''' form.  Once the '''OPB''' current '''Template Properties''' form is established as a '''multiple-project Template Properties''' form, go to the '''Rows/Swimlanes''' tab and make sure that the '''Group rows into swimlanes''' and '''Label swimlanes by''' windows are set to '''Project'''.  Also, for this illustration, make sure that '''text columns''' are displayed and that the '''Custom Text Columns''' are set to '''Phase'''. 
+
 
+
The '''Rows/Swimlanes''' tab in the '''Template Properties''' form looks like this:
+
 
+
<center>[[File:X71-8_4_1-71-(3)-11232021.png]]</center>
+
<center>X71-8_4_1-71-(3)-11232021.png</center>
+
<center>[[File:P71-8_5_3-71-(9)-12012021.png]]</center>
+
<center>P71-8_5_3-71-(9)-12012021.png</center>
+
 
+
When the steps above are completed and the '''Template Properties''' form for is '''updated''', click the '''Save and use''' button to make the modified '''Template Properties''' form the current '''Template'''.
+
 
+
===Create a Multi-Project Chart from Separate Multiple Microsoft Excel Separate Plans===
+
 
+
====Launch Microsoft Excel and Load the First Microsoft Excel Source Plan====
+
 
+
For this example the '''OPX Add-in''' application is used although '''OPB Add-in''' operates in the same way.  Launch Microsoft Excel and open the first of the multi-project Microsoft Excel '''source plans'''.  In this case it’s the '''Merlin-Project Phase 1 and 2''' file. 
+
 
+
Next, launch '''OPX''' from the Microsoft Excel '''Add-in''' tab.  The '''OnePager Express Start''' form appears. 
+
 
+
Click the '''NEW''' button which accesses the OnePager choices ('''OPC''') form as shown below:
+
 
+
<center>[[File:X70-8_4_1-70-(4)-08302019.png]]</center>
+
<center>X70-8_4_1-70-(4)-08302019.png</center>
+
<center>[[File:P71-8_5_3-71-(10)-12012021.png]]</center>
+
<center>P71-8_5_3-71-(10)-12012021.png</center>
+
 
+
Note that the '''Merlin-Project Phase 1 and 2.xlsx''' Microsoft Excel '''source plan''' appears in the '''Selected File(s)''' group and that the '''Add/Remove''' button is active.
+
 
+
====Adding the Second Microsoft Excel Source Plan====
+
 
+
Click the '''Add/Remove''' button which accesses the '''Data source selection''' form as shown below:
+
 
+
<center>[[File:X70-8_4_1-70-(5)-08302019.png]]</center>
+
<center>X70-8_4_1-70-(5)-08302019.png</center>
+
<center>[[File:P71-8_5_3-71-(11)-12012021.png]]</center>
+
<center>P71-8_5_3-71-(11)-12012021.png</center>
+
 
+
We want to now '''add''' the other Microsoft Excel '''source plan''' to the '''source packet'''.  To do this, click the '''ADD''' button in the '''Data source selection''' form and a Windows '''Open''' form appears.  Navigate to the desired '''source plan''', select it, and then click the '''Open''' button as shown below:
+
 
+
<center>[[File:X70-8_4_1-70-(6)-08302019.png]]</center>
+
<center>X70-8_4_1-70-(6)-08302019.png</center>
+
<center>[[File:P71-8_5_3-71-(12)-12012021.png]]</center>
+
<center>P71-8_5_3-71-(12)-12012021.png</center>
+
 
+
After you’ve completed placing the third Microsoft Excel '''source plan''' into the '''source packet''', the window in the '''Data source selection''' form looks like this:
+
 
+
<center>[[File:X70-8_4_1-70-(7)-08302019.png]]</center>
+
<center>X70-8_4_1-70-(7)-08302019.png</center>
+
<center>[[File:P71-8_5_3-71-(13)-12012021.png]]</center>
+
<center>P71-8_5_3-71-(13)-12012021.png</center>
+
 
+
When you click the '''OK''' button above, the '''OPC''' form is '''updated''' to reflect that two (2) '''source plans''' are in the '''source packet''' and the '''title''' for the new chart that we typed in as shown here:
+
 
+
<center>[[File:X70-8_4_1-70-(8)-08302019.png]]</center>
+
<center>X70-8_4_1-70-(8)-08302019.png</center>
+
<center>[[File:P71-8_5_3-71-(14)-12012021.png]]</center>
+
<center>P71-8_5_3-71-(14)-12012021.png</center>
+
 
+
====Create the NEW OnePager Express Multi-Project Chart====
+
 
+
When you click the '''Next>''' button, '''OPX''' goes to the second page of the '''OPC''' form where you can confirm other settings or make any '''Template Properties''' form setting changes. 
+
 
+
When these confirmations are complete, click the '''Create new chart''' button.  The chart looks like this:
+
 
+
<center>[[File:X70-8_4_1-70-(9)-08302019.png]]</center>
+
<center>X70-8_4_1-70-(9)-08302019.png</center>
+
<center>[[File:P71-8_5_3-71-(15)-12012021.png]]</center>
+
<center>P71-8_5_3-71-(15)-12012021.png</center>
+
 
+
Once you '''merge''' all your projects into a single snapshot, you can now '''add''' a new snapshot to the chart to show how tasks changed.
+
 
+
===Updating a Chart Created from Multiple Microsoft Excel Source Plans===
+
 
+
Eventually you want to '''update''' your '''multi-project''' chart by either '''adding''' a snapshot or '''replacing''' a snapshot with '''updated''' data.  To perform either the '''add''' or the '''replace''' snapshot, the processes described in these two referenced article references that follow can be used.
+
 
+
<center>
+
{| class="wikitable"
+
| [[REPLACING a Snapshot via Pull Operation for Version 7.1 | REPLACING a Snapshot via Pull Operation]] 7.14.1-71
+
 
|-
 
|-
| [[ADDING a Snapshot via Pull Operation for Version 7.1 | ADDING a Snapshot via Pull Operation]] 7.15.1-71
+
| [[Template Only Features for OnePager Express for Version 7.2 | Template Only Features for OnePager Express]] 24.2.1-72
 +
| [[Template Only Features for Primavera P6 Source Plans in OnePager Version 7.2 | Template Only Features for Primavera P6 Source Plans in OnePager]] 24.2.2-72
 +
|-
 +
| [[Template Only Features for Smartsheet Source Plans in OnePager Version 7.2 | Template Only Features for Smartsheet Source Plans in OnePager]] 24.2.3-72
 +
| [[Splitting and Parsing Columns for OnePager Pro for Version 7.2 | Splitting and Parsing Fields for OnePager Pro]] 24.4.1-72
 +
|-
 +
| [[Splitting and Parsing Columns for OnePager Express for Version 7.2 | Splitting and Parsing Fields for OnePager Express]] 24.5.1-72
 +
| [[Splitting and Parsing Columns for Primavera P6 Source Plans in OnePager Version 7.2 | Splitting and Parsing Columns for Primavera P6 Source Plans in OnePager]] 24.5.2-72
 +
|-
 +
| [[Splitting and Parsing Columns for Smartsheet Source Plans in OnePager Version 7.2 | Splitting and Parsing Columns for Smartsheet Source Plans in OnePager]] 24.5.3-72
 +
| [[Splitting and Parsing Columns for Project for the Web Source Plans for Version 7.2 | Splitting and Parsing Columns for Project for the Web Source Plans]] 24.5.5-72
 +
|-
 +
| [[Splitting and Parsing Columns for Planisware Enterprise Source Plans for Version 7.2 | Splitting and Parsing Columns for Planisware Enterprise Source Plans]] 24.5.7-72
 +
| [[Splitting and Parsing Columns for Wrike in OnePager Version 7.2 | Splitting and Parsing Columns for Wrike in OnePager]] 24.5.11-72
 
|}
 
|}
</center>
 
 
The key to making '''updated''' '''multi-project''' charts from '''multiple''' Microsoft '''source plan''' is the proper management of the Microsoft Excel data in the '''source packet'''.  Recall that the '''source packet''' contains the '''source plan(s)''' that are to be used to either create or '''update''' a chart. 
 
 
They are stored as '''file names''' and '''path names''' in the chart’s '''.TAM''' file and can be accessed from the '''Data''' tab’s '''Selected file(s)''' button on the ribbon as shown below:
 
 
<center>[[File:X70-8_4_1-70-(10)-08302019.png]]</center>
 
<center>X70-8_4_1-70-(10)-08302019.png</center>
 
<center>[[File:P71-8_5_3-71-(16)-12012021.png]]</center>
 
<center>P71-8_5_3-71-(16)-12012021.png</center>
 
 
Validating the contents of the '''source packet''' and assuring that these are the Microsoft Excel '''source plans''' that were '''updated''' is an essential step before proceeding to perform a project '''update'''.
 
 
==Related Links==
 
 
[[Creating a NEW Chart via Pull Operation Feature for Version 7.1 | Creating a NEW Chart via Pull Operation Feature]] 7.13.1-71
 
 
[[REPLACING a Snapshot via Pull Operation for Version 7.1 | REPLACING a Snapshot via Pull Operation]] 7.14.1-71
 
 
[[ADDING a Snapshot via Pull Operation for Version 7.1 | ADDING a Snapshot via Pull Operation]] 7.15.1-71
 
  
(8.5.3-71)
+
(24.5.9-72)
  
[[Category:Version 7.1]]
+
[[Category:Version 7.2]]
[[Category:Desktop]]
+
[[Category:Editing the Chart]]
[[Category:Basic Workflows]]
+
[[Category:Task/Milestone Editing]]
[[Category:Multi-Project Formats]]
+
[[Category:Column Splitting]]
[[Category:Conditional Import Filters]]
+
[[Category:Templates]]
+
[[Category:OnePager Choices Form]]
+
 
[[Category:Charts]]
 
[[Category:Charts]]
[[Category:Sharing Output]]
+
[[Category:Task Links]]
[[Category:Smartsheet]]
+
[[Category:Ribbon]]
 +
[[Category:Snapshots]]
 +
[[Category:Template Properties Form]]
 +
[[Category:Chart Properties Form]]
 +
[[Category:Asana]]
 
[[Category:OnePager Bundle]]
 
[[Category:OnePager Bundle]]

Latest revision as of 20:52, 27 November 2023

Introduction

This article is focused on using the Column Splitting feature with OnePager Bundle Standalone and imported Asana source plans.

About Splitting and Parsing Fields

The OnePager column splitting feature allows you to duplicate task bars when a task in your Asana source plan is assigned to multiple resources (or anything else). Because assignments from Asana often are comma-delimited, this feature enables OnePager to parse the comma-delimited list and create a unique task bar for each instance in the comma-separated list.

Split Resource Names Example

Say you want to use color-codes on task bars/milestone symbols based upon your Asana source plan’s Assigned to column as shown below:
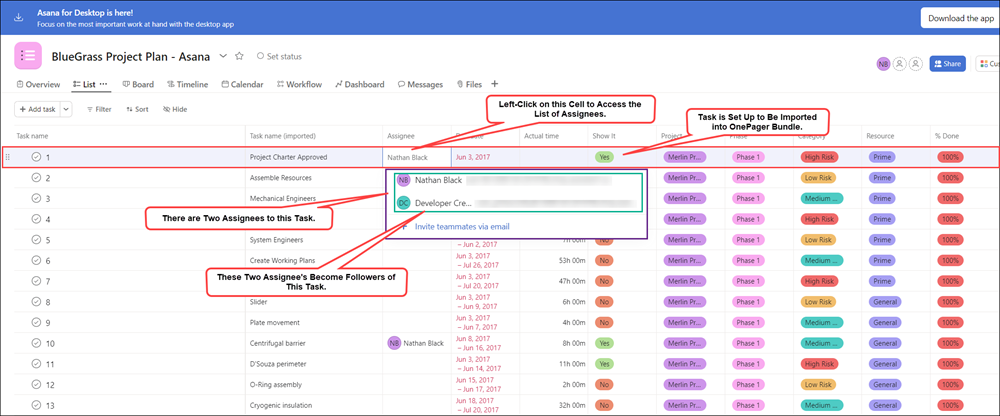
P72-24 5 3-72-(1)-11022023.png
P72-24_5_3-72-(1)-11022023.png

Some of the entries in the Assigned to column consist of multiple, comma-separated items and some tasks only used one resource. Without the column splitting feature, a chart created from these data and assigned task bar/milestone symbol colors based upon the Assigned to column looks like this:
P72-24 5 3-72-(5)-11272023.png
P72-24_5_3-72-(5)-11272023.png

OnePager, in this case, treats the entire string as an individual Assigned to value. To provide more flexibility in displaying task bars that have multiple resources assigned, OnePager supports the concept of a column splitting. This feature recognizes comma-separated values in a designated column and creates a separate task bar for each of the comma-separated values.

Enabling Splitting

To use this feature requires turning ON the feature in the Asana Template Properties form you intend to use to make the chart. The setting must be turned ON before the chart is created so launch OnePager Bundle from the desktop icon, click the NEW button on the OnePager Bundle Start form to access the OnePager choices form, select your Asana source plan, and type in the chart's title as shown here:
P72-24 5 3-72-(2A)-11022023.png
P72-24_5_3-72-(2A)-11022023.png

When you click the Next> button at the bottom of the form, OnePager accesses the second page of the OnePager choices form shown below:
P72-24 5 3-72-(2AA)-11022023.png
P72-24_5_3-72-(2AA)-11022023.png

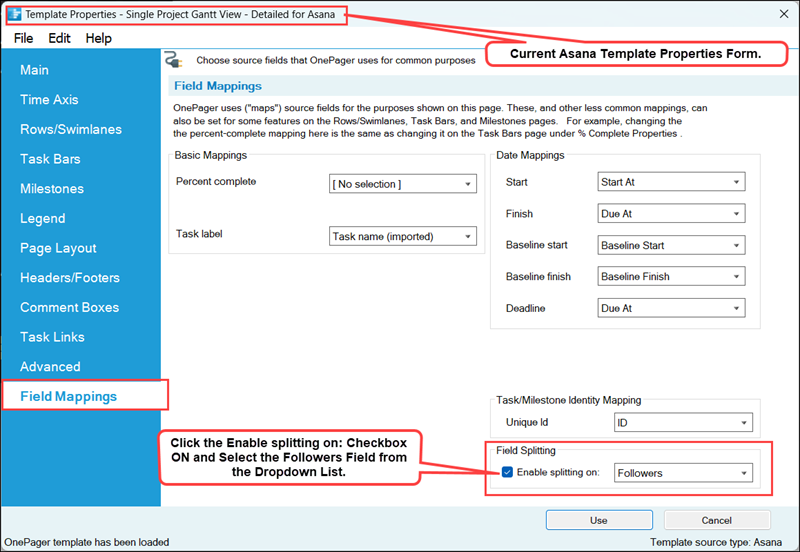
Clicking the Edit current template button accesses the current Template Properties form. Navigate to the Field Mappings tab on the form, check the Enable splitting on: checkbox to ON and (in this example) select the Assigned To column from the dropdown list provided. The results are shown here:
P72-24 5 3-72-(2AAA)-11022023.png
P72-24_5_3-72-(2AAA)-11022023.png

Click the Save and use button to complete the process and close the current Template Properties form returning you to the second page of the OnePager choices form show above.

Split Resources in the Chart

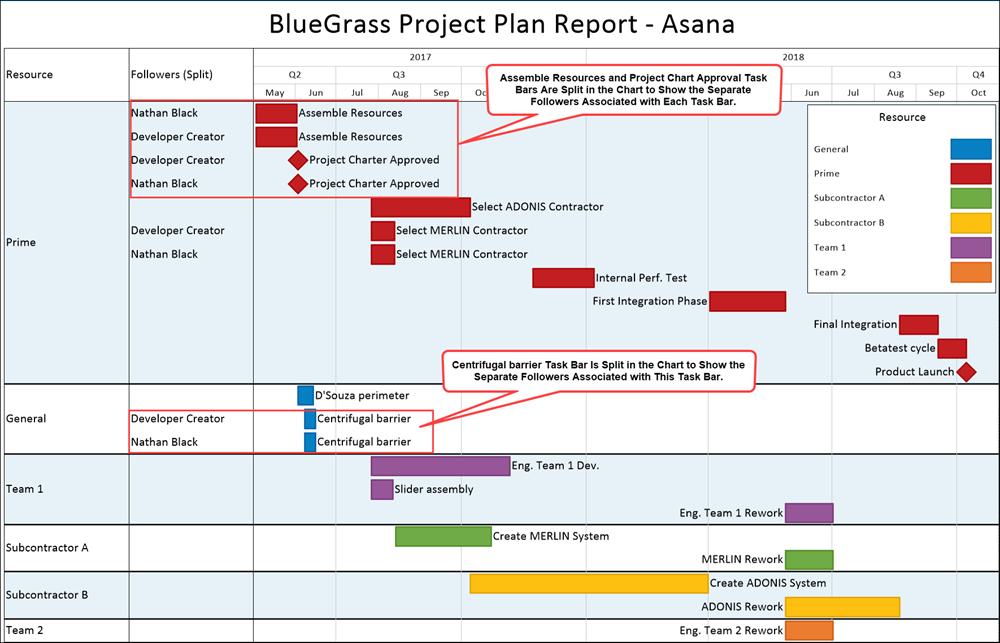
Clicking the Create new chart button completes the process and creates the chart with the column splitting feature in use. The chart with splitting looks like this:
P72-24 5 3-72-(2)-11022023.png
P72-24_5_3-72-(2)-11022023.png

In the chart with column splitting shown above, there are now several more task bars in the Chart Editor than there were before. The task bar for Plate Movement is now split into two (2) separate task bars, one for each of the two resources assigned. The task bar for Centrifugal Barrier is now split into three (3) separate task bars, one for each of the three resources that were assigned to this task in the Asana source plan. Each of the resources has a unique color assigned. Each of the resources appears by itself in the Legend. The Legend title shows the column name that is used for splitting the columns.

With this feature, you can use column splitting just like any other column by using the dropdowns in the Template Properties form or Chart Properties form to assign colors, highlight task bars and milestone symbols, and to define and label rows and swimlanes.

Splitting Resources and Task Links

When task bars with Data-Driven or manual Task Links are split, the Task Links (Data-Driven and manual) are not shown. Further, the Task Links that are now hidden and do not have entries in the Where are My Links? form.

Related Links

Templates versus Charts 4.0.1.3-72 Linking Task and Milestone Using Manual and Data-Driven Task Links (Portal) 19.0.1-72
Editing with the Chart Properties form (Portal) 21.0.1-72 Template Only Features for OnePager Pro 24.1.1-72
Template Only Features for OnePager Express 24.2.1-72 Template Only Features for Primavera P6 Source Plans in OnePager 24.2.2-72
Template Only Features for Smartsheet Source Plans in OnePager 24.2.3-72 Splitting and Parsing Fields for OnePager Pro 24.4.1-72
Splitting and Parsing Fields for OnePager Express 24.5.1-72 Splitting and Parsing Columns for Primavera P6 Source Plans in OnePager 24.5.2-72
Splitting and Parsing Columns for Smartsheet Source Plans in OnePager 24.5.3-72 Splitting and Parsing Columns for Project for the Web Source Plans 24.5.5-72
Splitting and Parsing Columns for Planisware Enterprise Source Plans 24.5.7-72 Splitting and Parsing Columns for Wrike in OnePager 24.5.11-72

(24.5.9-72)