Difference between revisions of "Testing Article1"
(→Split Resources in the Chart) |
|||
| (478 intermediate revisions by 2 users not shown) | |||
| Line 1: | Line 1: | ||
| − | == | + | ==Introduction== |
| − | ''' | + | This article is focused on using the ''' Column Splitting''' feature with OnePager Bundle '''Standalone''' and '''imported''' Asana '''source plans'''. |
| − | + | ==About Splitting and Parsing Fields== | |
| − | + | The OnePager '''column splitting''' feature allows you to '''duplicate task bars''' when a task in your Asana '''source plan''' is assigned to '''multiple resources''' (or anything else). Because assignments from Asana often are '''comma-delimited''', this feature enables OnePager to '''parse the comma-delimited list''' and '''create a unique task bar''' for each instance in the '''comma-separated''' list. | |
| − | + | ===Split Resource Names Example=== | |
| − | + | Say you want to use '''color-codes''' on task bars/milestone symbols based upon your Asana '''source plan’s Assigned to''' column as shown below: | |
| − | + | ||
| − | + | <center>[[File:P72-24_5_3-72-(1)-11022023.png]]</center> | |
| + | <center>P72-24_5_3-72-(1)-11022023.png</center> | ||
| − | + | Some of the entries in the '''Assigned to''' column consist of multiple, '''comma-separated''' items and some tasks only used one '''resource'''. Without the '''column splitting''' feature, a chart '''created''' from these data and assigned task bar/milestone symbol '''colors''' based upon the '''Assigned to''' column looks like this: | |
| − | + | ||
| − | + | <center>[[File:P72-24_5_3-72-(5)-11272023.png]]</center> | |
| + | <center>P72-24_5_3-72-(5)-11272023.png</center> | ||
| − | + | OnePager, in this case, treats the '''entire string''' as an individual '''Assigned to''' value. To provide more flexibility in displaying task bars that have '''multiple resources''' assigned, OnePager supports the concept of a '''column splitting'''. This feature recognizes '''comma-separated''' values in a '''designated column''' and '''creates a separate task bar''' for each of the '''comma-separated''' values. | |
| − | + | ||
| − | === | + | ===Enabling Splitting=== |
| − | ''' | + | To use this feature requires turning '''ON''' the feature in the Asana '''Template Properties''' form you intend to use to make the chart. The setting must be turned '''ON''' before the chart is created so launch OnePager Bundle from the '''desktop icon''', click the '''NEW''' button on the '''OnePager Bundle Start''' form to access the '''OnePager choices''' form, '''select''' your Asana '''source plan''', and type in the chart's '''title''' as shown here: |
| − | + | <center>[[File:P72-24_5_3-72-(2A)-11022023.png]]</center> | |
| + | <center>P72-24_5_3-72-(2A)-11022023.png</center> | ||
| − | + | When you click the '''Next>''' button at the bottom of the form, OnePager accesses the second page of the '''OnePager choices''' form shown below: | |
| − | + | <center>[[File:P72-24_5_3-72-(2AA)-11022023.png]]</center> | |
| + | <center>P72-24_5_3-72-(2AA)-11022023.png</center> | ||
| − | ''' | + | Clicking the '''Edit current template''' button accesses the current '''Template Properties''' form. Navigate to the '''Field Mappings''' tab on the form, check the '''Enable splitting on:''' checkbox to '''ON''' and (in this example) select the '''Assigned To''' column from the dropdown list provided. The results are shown here: |
| − | <center>[[File: | + | <center>[[File:P72-24_5_3-72-(2AAA)-11022023.png]]</center> |
| − | <center> | + | <center>P72-24_5_3-72-(2AAA)-11022023.png</center> |
| − | + | Click the '''Save and use''' button to complete the process and close the current '''Template Properties''' form returning you to the second page of the '''OnePager choices''' form show above. | |
| − | === | + | ===Split Resources in the Chart=== |
| − | + | Clicking the '''Create new chart''' button completes the process and creates the chart with the '''column splitting''' feature in use. The chart with '''splitting''' looks like this: | |
| − | <center>[[File: | + | <center>[[File:P72-24_5_3-72-(2)-11022023.png]]</center> |
| − | + | <center>P72-24_5_3-72-(2)-11022023.png</center> | |
| − | + | In the chart with '''column splitting''' shown above, there are now several more task bars in the '''Chart Editor''' than there were before. The task bar for '''Plate Movement''' is now '''split into two (2) separate task bars''', one for each of the '''two resources assigned'''. The task bar for '''Centrifugal Barrier''' is now '''split into three (3) separate task bars''', one for each of the '''three resources''' that were assigned to this task in the Asana '''source plan'''. Each of the '''resources''' has a unique '''color''' assigned. Each of the '''resources''' appears by itself in the '''Legend'''. The '''Legend title''' shows the '''column name''' that is used for '''splitting the columns'''. | |
| − | + | With this feature, you can use '''column splitting''' just like any other column by using the dropdowns in the '''Template Properties''' form or '''Chart Properties''' form to assign '''colors, highlight task bars and milestone symbols, and to define and label rows and swimlanes'''. | |
| − | == | + | ==Splitting Resources and Task Links== |
| − | + | When task bars with '''Data-Driven''' or manual '''Task Links''' are '''split''', the '''Task Links''' ('''Data-Driven''' and manual) are '''not shown'''. Further, the '''Task Links''' that are now '''hidden''' and '''do not''' have entries in the '''Where are My Links?''' form. | |
| − | + | ||
| − | + | ||
| − | + | ||
| − | + | ||
| − | + | ||
| − | + | ||
| − | + | ||
| − | + | ||
| − | + | ||
| − | + | ||
| − | + | ||
| − | + | ||
| − | + | ||
| − | + | ||
| − | + | ||
| − | + | ||
| − | + | ||
| − | + | ||
| − | + | ||
| − | + | ||
| − | + | ||
| − | + | ||
| − | + | ||
| − | + | ||
| − | + | ||
| − | + | ||
| − | + | ||
| − | + | ||
| − | + | ||
| − | + | ||
| − | + | ||
| − | + | ||
| − | + | ||
| − | + | ||
| − | + | ||
| − | + | ||
| − | + | ||
| − | + | ||
| − | + | ||
| − | + | ||
| − | + | ||
| − | + | ||
| − | + | ||
| − | + | ||
| − | + | ||
| − | + | ||
| − | + | ||
| − | + | ||
| − | + | ||
| − | + | ||
| − | + | ||
| − | + | ||
| − | + | ||
| − | + | ||
| − | ''' | + | |
| − | + | ||
| − | + | ||
| − | + | ||
| − | + | ||
| − | ''' | + | |
| − | + | ||
| − | + | ||
| − | + | ||
| − | + | ||
| − | + | ||
| − | + | ||
| − | + | ||
| − | + | ||
| − | + | ||
| − | + | ||
| − | + | ||
| − | + | ||
| − | + | ||
| − | + | ||
| − | + | ||
| − | + | ||
| − | + | ||
| − | + | ||
| − | + | ||
| − | + | ||
| − | + | ||
| − | + | ||
| − | + | ||
| − | + | ||
| − | + | ||
| − | + | ||
| − | + | ||
| − | + | ||
| − | + | ||
| − | + | ||
| − | + | ||
| − | + | ||
| − | + | ||
| − | + | ||
| − | + | ||
| − | + | ||
| − | + | ||
| − | + | ||
| − | + | ||
| − | + | ||
| − | + | ||
| − | + | ||
| − | + | ||
| − | + | ||
| − | + | ||
| − | + | ||
| − | + | ||
| − | + | ||
| − | + | ||
| − | + | ||
| − | + | ||
| − | + | ||
| − | + | ||
| − | + | ||
| − | + | ||
| − | + | ||
| − | + | ||
| − | + | ||
| − | + | ||
| − | + | ||
| − | + | ||
| − | + | ||
| − | + | ||
| − | + | ||
| − | + | ||
| − | + | ||
| − | + | ||
| − | + | ||
| − | + | ||
| − | + | ||
| − | + | ||
==Related Links== | ==Related Links== | ||
| − | [[ | + | {| class="wikitable" |
| − | + | | [[Templates versus Charts for Version 7.2 | Templates versus Charts]] 4.0.1.3-72 | |
| − | [[ | + | | [[Linking Task and Milestones Using Manual and Data-Driven Task Links for Version 7.2 | Linking Task and Milestone Using Manual and Data-Driven Task Links (Portal)]] 19.0.1-72 |
| − | + | |- | |
| − | [[ | + | | [[Editing with the Chart Properties form for Version 7.2 (Portal) | Editing with the Chart Properties form (Portal)]] 21.0.1-72 |
| − | + | | [[Template Only Features for OnePager Pro for Version 7.2 | Template Only Features for OnePager Pro]] 24.1.1-72 | |
| − | [[ | + | |- |
| − | + | | [[Template Only Features for OnePager Express for Version 7.2 | Template Only Features for OnePager Express]] 24.2.1-72 | |
| − | [[ | + | | [[Template Only Features for Primavera P6 Source Plans in OnePager Version 7.2 | Template Only Features for Primavera P6 Source Plans in OnePager]] 24.2.2-72 |
| − | + | |- | |
| − | [[ | + | | [[Template Only Features for Smartsheet Source Plans in OnePager Version 7.2 | Template Only Features for Smartsheet Source Plans in OnePager]] 24.2.3-72 |
| − | + | | [[Splitting and Parsing Columns for OnePager Pro for Version 7.2 | Splitting and Parsing Fields for OnePager Pro]] 24.4.1-72 | |
| − | [[ | + | |- |
| − | + | | [[Splitting and Parsing Columns for OnePager Express for Version 7.2 | Splitting and Parsing Fields for OnePager Express]] 24.5.1-72 | |
| − | [[ | + | | [[Splitting and Parsing Columns for Primavera P6 Source Plans in OnePager Version 7.2 | Splitting and Parsing Columns for Primavera P6 Source Plans in OnePager]] 24.5.2-72 |
| + | |- | ||
| + | | [[Splitting and Parsing Columns for Smartsheet Source Plans in OnePager Version 7.2 | Splitting and Parsing Columns for Smartsheet Source Plans in OnePager]] 24.5.3-72 | ||
| + | | [[Splitting and Parsing Columns for Project for the Web Source Plans for Version 7.2 | Splitting and Parsing Columns for Project for the Web Source Plans]] 24.5.5-72 | ||
| + | |- | ||
| + | | [[Splitting and Parsing Columns for Planisware Enterprise Source Plans for Version 7.2 | Splitting and Parsing Columns for Planisware Enterprise Source Plans]] 24.5.7-72 | ||
| + | | [[Splitting and Parsing Columns for Wrike in OnePager Version 7.2 | Splitting and Parsing Columns for Wrike in OnePager]] 24.5.11-72 | ||
| + | |} | ||
| − | ( | + | (24.5.9-72) |
| − | [[Category:Version 7. | + | [[Category:Version 7.2]] |
| − | + | ||
[[Category:Editing the Chart]] | [[Category:Editing the Chart]] | ||
| + | [[Category:Task/Milestone Editing]] | ||
| + | [[Category:Column Splitting]] | ||
[[Category:Charts]] | [[Category:Charts]] | ||
| − | [[Category: | + | [[Category:Task Links]] |
| − | + | ||
| − | + | ||
| − | + | ||
| − | + | ||
| − | + | ||
| − | + | ||
[[Category:Ribbon]] | [[Category:Ribbon]] | ||
[[Category:Snapshots]] | [[Category:Snapshots]] | ||
| − | [[Category: | + | [[Category:Template Properties Form]] |
| − | [[Category: | + | [[Category:Chart Properties Form]] |
| − | [[Category: | + | [[Category:Asana]] |
| − | [[Category: | + | [[Category:OnePager Bundle]] |
Latest revision as of 20:52, 27 November 2023
Contents
Introduction
This article is focused on using the Column Splitting feature with OnePager Bundle Standalone and imported Asana source plans.
About Splitting and Parsing Fields
The OnePager column splitting feature allows you to duplicate task bars when a task in your Asana source plan is assigned to multiple resources (or anything else). Because assignments from Asana often are comma-delimited, this feature enables OnePager to parse the comma-delimited list and create a unique task bar for each instance in the comma-separated list.
Split Resource Names Example
Say you want to use color-codes on task bars/milestone symbols based upon your Asana source plan’s Assigned to column as shown below:
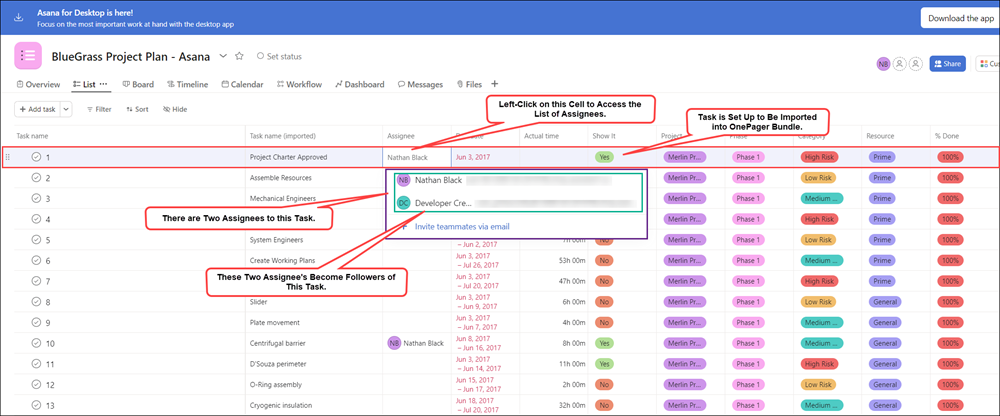
Some of the entries in the Assigned to column consist of multiple, comma-separated items and some tasks only used one resource. Without the column splitting feature, a chart created from these data and assigned task bar/milestone symbol colors based upon the Assigned to column looks like this:
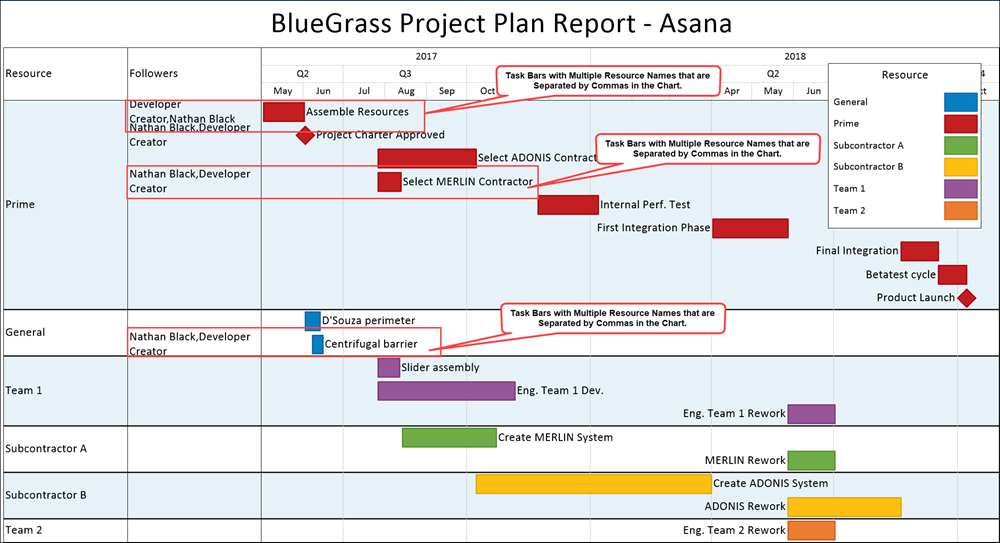
OnePager, in this case, treats the entire string as an individual Assigned to value. To provide more flexibility in displaying task bars that have multiple resources assigned, OnePager supports the concept of a column splitting. This feature recognizes comma-separated values in a designated column and creates a separate task bar for each of the comma-separated values.
Enabling Splitting
To use this feature requires turning ON the feature in the Asana Template Properties form you intend to use to make the chart. The setting must be turned ON before the chart is created so launch OnePager Bundle from the desktop icon, click the NEW button on the OnePager Bundle Start form to access the OnePager choices form, select your Asana source plan, and type in the chart's title as shown here:
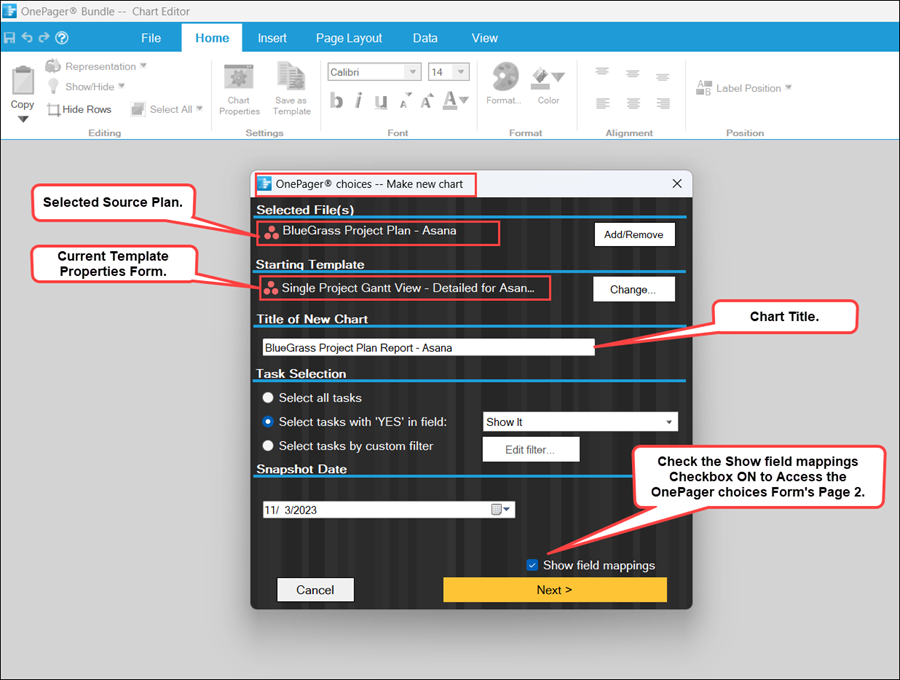
When you click the Next> button at the bottom of the form, OnePager accesses the second page of the OnePager choices form shown below:
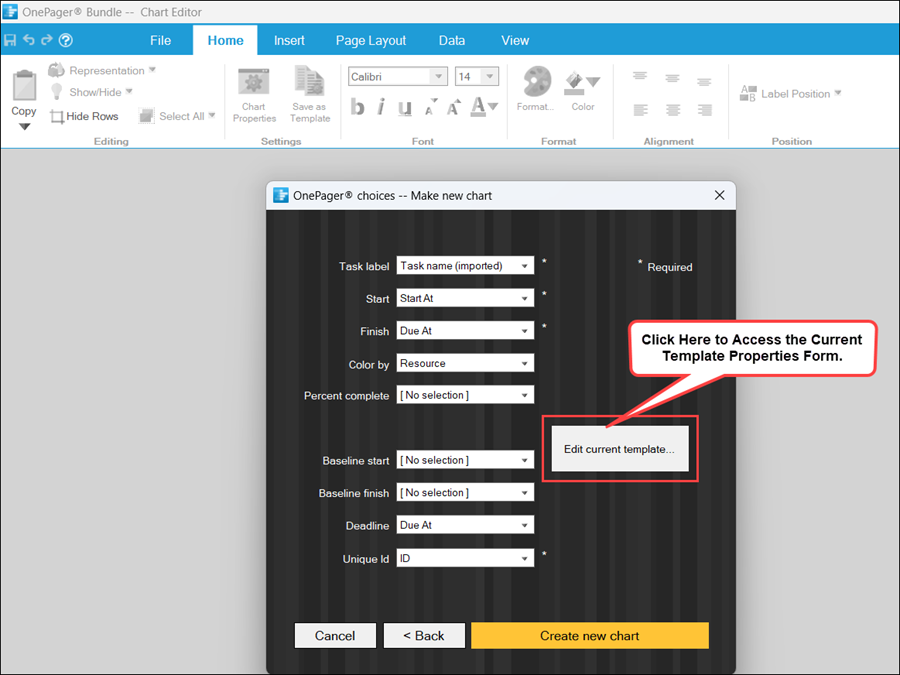
Clicking the Edit current template button accesses the current Template Properties form. Navigate to the Field Mappings tab on the form, check the Enable splitting on: checkbox to ON and (in this example) select the Assigned To column from the dropdown list provided. The results are shown here:
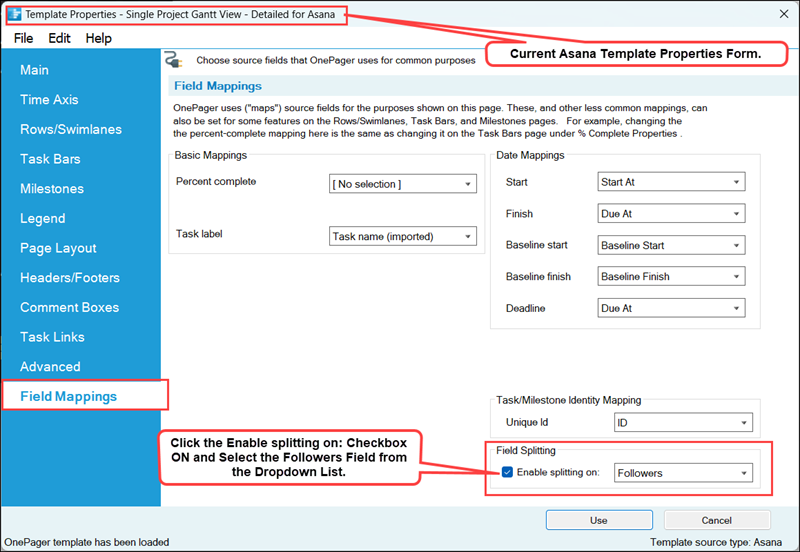
Click the Save and use button to complete the process and close the current Template Properties form returning you to the second page of the OnePager choices form show above.
Split Resources in the Chart
Clicking the Create new chart button completes the process and creates the chart with the column splitting feature in use. The chart with splitting looks like this:
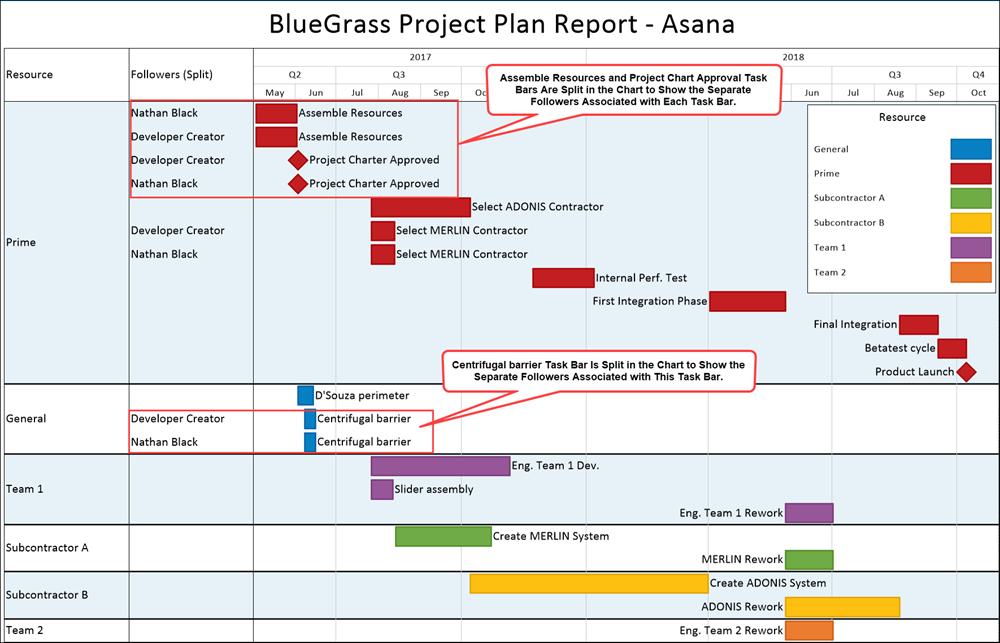
In the chart with column splitting shown above, there are now several more task bars in the Chart Editor than there were before. The task bar for Plate Movement is now split into two (2) separate task bars, one for each of the two resources assigned. The task bar for Centrifugal Barrier is now split into three (3) separate task bars, one for each of the three resources that were assigned to this task in the Asana source plan. Each of the resources has a unique color assigned. Each of the resources appears by itself in the Legend. The Legend title shows the column name that is used for splitting the columns.
With this feature, you can use column splitting just like any other column by using the dropdowns in the Template Properties form or Chart Properties form to assign colors, highlight task bars and milestone symbols, and to define and label rows and swimlanes.
Splitting Resources and Task Links
When task bars with Data-Driven or manual Task Links are split, the Task Links (Data-Driven and manual) are not shown. Further, the Task Links that are now hidden and do not have entries in the Where are My Links? form.
Related Links
(24.5.9-72)