Difference between pages "Using Fiscal Years and Weeks for OnePager Live Beta 2 (MS Project Source)" and "ADDING a Snapshot via Push Update to a OnePager Chart for Version 7.2"
(Created page with "==About Fiscal Years and Weeks== 22.2.1-OPL2 from 22.2.1-60 7/17/2017 OnePager has date formats for both '''calendar year''' and '''fiscal year''' representations. '''Date...") |
(→OnePager Express Standalone Push Update) |
||
| Line 1: | Line 1: | ||
| − | == | + | ==Introduction== |
| − | + | This article has six (6) major sections below. The first and second major sections are associated with OnePager Pro '''Add-in''' and '''Standalone''', respectively. The third and fourth major sections are are associated with OnePager Express '''Add-in''' and '''Standalone''', respectively. The last two major sections are for OnePager Bundle users. These last two section direct you to the appropriate portions of this article where you can find the instructions for '''ADDING a Snapshot''' to a chart previously created from any one of the '''source plans''' supported by OnePager Bundle (i.e., Microsoft Project, Microsoft Excel, Oracle Primavera P6, or Smartsheet). | |
| − | + | Please use the table below to accesses the desired sub-section: | |
| − | + | <center> | |
| + | {| class="wikitable" | ||
| + | | [[ADDING a Snapshot via Push Update to a OnePager Chart for Version 7.2#OnePager Pro Add-in Push Update | OnePager Pro Add-in Push Update]] 7.7.1-72 | ||
| + | |- | ||
| + | | [[ADDING a Snapshot via Push Update to a OnePager Chart for Version 7.2#OnePager Pro Standalone Push Update | OnePager Pro Standalone Push Update]] 7.7.1-72 | ||
| + | |- | ||
| + | | [[ADDING a Snapshot via Push Update to a OnePager Chart for Version 7.2#OnePager Express Add-in Push Update | OnePager Express Add-in Push Update]] 7.7.1-72 | ||
| + | |- | ||
| + | | [[ADDING a Snapshot via Push Update to a OnePager Chart for Version 7.2#OnePager Express Standalone Push Update | OnePager Express Standalone Push Update]] 7.7.1-72 | ||
| + | |- | ||
| + | | [[ADDING a Snapshot via Push Update to a OnePager Chart for Version 7.2#OnePager Bundle Add-in Push Update | OnePager Bundle Add-in Push Update]] 7.7.1-72 | ||
| + | |- | ||
| + | | [[ADDING a Snapshot via Push Update to a OnePager Chart for Version 7.2#OnePager Bundle Standalone Push Update | OnePager Bundle Standalone Push Update]] 7.7.1-72 | ||
| + | |} | ||
| + | </center> | ||
| − | + | ==OnePager Pro Add-in Push Update== | |
| − | + | ||
| − | + | ||
| − | + | ||
| − | + | ||
| − | + | During the course of a project, work is accomplished, new tasks '''start''', other tasks '''finish''', and, from time to time, '''dates''' are adjusted. These changes are usually picked up as part of a regular reporting process. When updated, the Microsoft Project '''source plan''' becomes the source for reporting schedule updates. | |
| − | + | OnePager uses the updated Microsoft Project '''source plan''' to '''add''' snapshots to record how the project progresses between reporting periods. One method that the OnePager '''Add-in''' uses is called the '''Push Update'''. By '''push''' we mean that the updated Microsoft Project '''source plan''' is '''Pushed''' to OnePager Pro. | |
| − | + | This distinction is important since OnePager also enables the '''Pull Update''' method where OnePager Pro loads the updated '''source plan''' file before processing the updates. | |
| − | + | For more information on the '''Pull method''' of '''adding''' a snapshot to the chart, please see the article at: [[ADDING a Snapshot via Pull Operation for Version 7.2 | ADDING a Snapshot via Pull Operation]] 7.15.1-72 | |
| − | + | The workflow for accomplishing this periodic process is shown below: | |
| − | + | ||
| − | : | + | <center>[[File:P71-7_7_1-71-(1)-11092021.png]]</center> |
| + | <!--<center>P71-7_7_1-71-(1)-11092021.png</center>--> | ||
| − | + | :1) Launch Microsoft Project and access a Microsoft Project '''source plan''' containing updated information. | |
| − | : | + | :2) Launch OnePager Pro from the Microsoft Project '''ADD-IN''' ribbon tool bar tab. |
| − | + | :3) Select the '''UPDATE''' button on the '''OnePager Pro Start''' form as shown below: | |
| − | + | <center>[[File:P70-7_7_1-70-(2)-08092019.png]]</center> | |
| + | <!--<center>P70-7_7_1-70-(2)-08092019.png</center>--> | ||
| − | + | :4) Clicking the '''UPDATE''' button displays a list of recently-used charts and the word '''BROWSE FILES…''' option. Select the desired chart as shown above and OnePager accesses the OnePager choices ('''OPC''') form shown here: | |
| − | <center>[[File: | + | <center>[[File:P71-7_7_1-71-(2A-1)-02082022.png]]</center> |
| + | <!--<center>P71-7_7_1-71-(2A-1)-02082022.png</center>--> | ||
| − | + | :5) Select the '''NEW snapshot at date:''' radio button and use the '''calendar''' dropdown list to select the '''date''' for this snapshot as shown here: | |
| − | <center>[[File: | + | <center>[[File:P71-7_7_1-71-(3-1)-02082022.png]]</center> |
| + | <!--<center>P71-7_7_1-71-(3-1)-02082022.png</center>--> | ||
| − | : | + | :6) Then, click '''Next>''' or '''New''' depending on whether the '''Show field mappings''' checkbox is checked '''ON'''. OnePager takes the Microsoft Project '''source plan''' data under the control of the '''Flag/Number''' field and produce a '''new''' snapshot in the chart at the '''date''' selected. |
| − | + | Once the updated chart is open, you can '''edit''', '''save''', and '''copy the chart''' to a Microsoft PowerPoint slide or elsewhere as described previously. When you '''save''' the chart, the newly created snapshot is stored in the chart’s '''.TAM''' file along with all its other snapshots. Some care needs to be taken to make sure that the update uses the correct '''Flag''' setting. A chart can contain as many snapshots as you like. The chart is designed to remember which '''Flag''' setting, so the '''updates''' are consistent unless you accidentally change the '''Flag'''. When there are multiple '''Flag/Number''' fields in a Microsoft Project '''source plan''' from which OnePager '''imports''' data, it’s a good idea to glance at the '''Flag''' setting before hitting the large '''New''' button. | |
| − | + | ==OnePager Pro Standalone Push Update== | |
| − | + | During the course of a project, work is accomplished, new tasks '''start''', other tasks '''finish''', and, from time to time, '''dates''' are adjusted. These changes are usually picked up as part of a regular reporting process. When updated, the Microsoft Project '''source plan''' becomes the source for reporting schedule updates. | |
| − | + | OnePager uses the updated Microsoft Project '''source plan''' to '''add''' snapshots to record how the project progresses between reporting periods. Once charts are created, they can be updated from the '''OnePager Pro Start''' form by launching OnePager from the '''Standalone Icon''' and doing a '''Push Update'''. By '''push''' we mean that the updated Microsoft Project '''source plan''' is '''Pushed''' to OnePager. This distinction is important since OnePager also enables the '''Pull Update''' method. | |
| − | + | For more information on the '''Pull method''' for adding a snapshot to the chart, please see the article at: [[ADDING a Snapshot via Pull Operation for Version 7.2 | ADDING a Snapshot via Pull Operation]] 7.15.1-72 | |
| − | + | The workflow for accomplishing this periodic process is shown below: | |
| − | : | + | <center>[[File:P71-7_7_2-71-(1)-11092021.png]]</center> |
| + | <!--<center>P71-7_7_2-71-(1)-11092021.png</center>--> | ||
| − | + | :1) Launch OnePager from the '''Standalone Icon'''. | |
| − | : | + | :2) The splash page appears briefly followed by the One Pager '''Chart Editor''' form displaying the '''OnePager Pro Start''' form. |
| − | + | :3) Select the '''UPDATE''' button on the '''OnePager Pro Start''' form as shown below: | |
| − | : | + | <center>[[File:P70-7_7_2-70-(2)-08092019.png]]</center> |
| + | <!--<center>P70-7_7_2-70-(2)-08092019.png</center>--> | ||
| − | + | :4) Clicking the '''UPDATE''' button displays a list of recently-used charts and the word '''BROWSE FILES…''' option. Select the desired chart as shown above and OnePager accesses the OnePager choices ('''OPC''') form shown here: | |
| − | + | <center>[[File:P71-7_7_1-71-(2A-1)-02182022.png]]</center> | |
| + | <!--<center>P71-7_7_1-71-(2A-1)-02182022.png</center>--> | ||
| − | + | :5) Select the '''NEW snapshot at date:''' radio button and use the '''calendar''' dropdown list to select the '''date''' for this snapshot as shown here: | |
| − | 1) | + | <center>[[File:P71-7_7_1-71-(3-1)-02182022.png]]</center> |
| + | <!--<center>P71-7_7_1-71-(3-1)-02182022.png</center>--> | ||
| − | : | + | :6) Then, click '''Next>''' or '''New''' depending on whether the '''Show column mappings''' checkbox is checked '''ON'''. |
| − | : | + | :7) OnePager takes the Microsoft Project '''source plan''' data under the control of the '''Flag/Number''' field and produce a '''new''' snapshot in the chart at the '''date''' selected. |
| − | + | Once the updated chart is open, you can '''edit''', '''save''', and '''copy the chart''' to a Microsoft PowerPoint slide or elsewhere as described previously. When you '''save''' the chart, the newly created snapshot is stored in the chart’s '''.TAM''' file along with all its other snapshots. Some care needs to be taken to make sure that the update uses the correct '''Flag''' setting. The chart is designed to remember which '''Flag''' setting, so the updates are consistent unless you accidentally change the '''Flag'''. A chart can contain as many snapshots as you like. When there are multiple '''Flag/Number''' fields in a Microsoft Project plan from which OnePager imports data, it’s a good idea to glance at the '''Flag''' setting before hitting the large '''New''' button. | |
| − | + | ==OnePager Express Add-in Push Update== | |
| − | + | During the course of a project, work is accomplished, new tasks '''start''', other tasks are '''finished''', and, from time to time, '''dates''' are adjusted. These occurrences are usually picked up as part of a regular reporting process. When updated, the Microsoft Excel plan becomes the source for reporting schedule updates. OnePager uses the updated Microsoft Excel '''source plan''' to add snapshots to record how the project changes from reporting period to reporting period. | |
| − | + | One method that the OnePager '''Add-in''' uses is called the '''Push Update'''. By '''push''' we mean that the updated Microsoft Excel plan is '''Pushed''' to OnePager. This distinction is important since OnePager also enables the '''Pull Update''' method. | |
| − | + | For more information on the '''Pull method''' for adding a snapshot to the chart, please see the article at: [[ADDING a Snapshot via Pull Operation for Version 7.2 | ADDING a Snapshot via Pull Operation]] 7.15.1-72 | |
| − | + | The workflow for accomplishing this periodic process is shown below: | |
| − | <center>[[File: | + | <center>[[File:X71-7_8_1-71-(1)-11092021.png]]</center> |
| + | <!--<center>X71-7_8_1-71-(1)-11092021.png</center>--> | ||
| − | + | :1) Launch Microsoft Excel and bring up a Microsoft Excel '''source plan''' containing updated information. Launch OnePager Express from the Microsoft Excel tool bar. | |
| − | + | :2) Launch OnePager and select the '''UPDATE''' button on the '''OnePager Express Start''' form as shown below: | |
| − | + | <center>[[File:X71-7_8_1-71-(2)-11092021.png]]</center> | |
| + | <!--<center>X71-7_8_1-71-(2)-11092021.png</center>--> | ||
| − | : | + | :3) Clicking the '''UPDATE''' button displays a list of recently-used charts and the word '''BROWSE FILES…''' option. Select the desired chart as shown above and OnePager accesses the OnePager choices ('''OPC''') form shown here: |
| − | :( | + | <center>[[File:X71-7_8_1-71-(3-1)-02182022.png]]</center> |
| + | <!--<center>X71-7_8_1-71-(3-1)-02182022.png</center>--> | ||
| − | : | + | :4) Select the '''NEW snapshot at date:''' radio button and use the calendar dropdown list to select the date for this snapshot as shown here: |
| − | + | <center>[[File:X71-7_8_1-71-(4-1)-02182022.png]]</center> | |
| + | <!--<center>X71-7_8_1-71-(4-1)-02182022.png</center>--> | ||
| − | + | :5) Then, click '''Next>''' or '''New''' depending on whether the '''Show field mappings''' box is checked. OnePager takes the Microsoft Excel '''source plan''' data under the control of the '''flag''' field and produce a new snapshot in the chart at the date selected. | |
| − | + | Once the updated chart is open, you can '''edit''', '''save''', and '''copy the chart''' to a Microsoft PowerPoint slide or elsewhere as described previously. When you save the chart, the newly created snapshot is stored in the chart’s '''.TAM''' file along with all its other snapshots. Some care needs to be taken to make sure that the update uses the correct '''Flag''' setting. The chart is designed to remember which '''Flag''' setting, so the updates are consistent unless you accidentally change the '''Flag'''. A chart can contain as many snapshots as you like. When there are multiple '''Flag''' fields in a Microsoft Excel plan from which OnePager imports data, it’s a good idea to glance at the '''Flag''' setting before hitting the large '''New''' button. | |
| − | == | + | ==OnePager Express Standalone Push Update== |
| − | + | During the course of a project, work is accomplished, new tasks '''start''', other tasks are '''finished''', and, from time to time, '''dates''' are adjusted. These occurrences are usually picked up as part of a regular reporting process. When updated, the Microsoft Excel plan becomes the source for reporting schedule updates. | |
| − | + | OnePager uses the updated Microsoft Excel '''source plan''' to add snapshots to record how the project changes from reporting period to reporting period. Once project views are created, they can be updated from the '''OnePager Express Start''' form by launching OnePager from the '''desktop icon''' and doing a '''push''' update. By '''push''' we mean that the updated Microsoft Excel plan is '''Pushed''' to OnePager. This distinction is important since OnePager also enables the '''Pull Update''' method. | |
| − | + | For more information on the '''Pull method''' for adding a snapshot to the chart, please see the article at: [[ADDING a Snapshot via Pull Operation for Version 7.2 | ADDING a Snapshot via Pull Operation]] 7.15.1-72 | |
| − | + | The workflow for accomplishing this periodic process is shown below: | |
| − | + | <center>[[File:X71-7_8_2-71-(1)-11092021.png]]</center> | |
| + | <!--<center>X71-7_8_2-71-(1)-11092021.png</center>--> | ||
| − | 1) | + | :1) Launch OnePager from the '''desktop icon'''. |
| − | + | :2) The splash page appears briefly followed by the One Pager '''Project View Editor''' ('''PVE''') form displaying the '''OnePager Express Start''' form. | |
| − | + | :3) Select the '''UPDATE''' button on the '''OnePager Express Start''' form as shown below: | |
| − | <center>[[File: | + | <center>[[File:X71-7_8_2-71-(2)-11092021.png]]</center> |
| + | <!--<center>X71-7_8_2-71-(2)-11092021.png</center>--> | ||
| − | + | :4) Clicking the '''UPDATE''' button displays a list of recently-used project views and the word '''BROWSE FILES…''' option. Select the desired project view as shown above and OnePager accesses the OnePager choices ('''OPC''') form shown here: | |
| − | 1) | + | <center>[[File:X71-7_8_1-71-(3-1)-02182022.png]]</center> |
| + | <!--<center>X71-7_8_1-71-(3-1)-02182022.png</center>--> | ||
| − | + | :5) Select the '''NEW snapshot at date:''' radio button and use the calendar dropdown list to select the date for this snapshot as shown here: | |
| − | + | <center>[[File:X71-7_8_1-71-(4-1)-02182022.png]]</center> | |
| + | <!--<center>X71-7_8_1-71-(4-1)-02182022.png</center>--> | ||
| − | + | :6) Then, click '''Next>''' or '''New''' depending on whether the '''Show field mappings''' box is checked. OnePager takes the Microsoft Excel plan data under the control of the '''flag''' field and produce a new snapshot in the project view at the date selected. | |
| − | + | Once the updated project view is open, you can '''edit''', '''save''', and '''copy the chart''' to a Microsoft PowerPoint slide or elsewhere as described previously. When you save the project view, the newly created snapshot is stored in the project view’s '''.TAM''' file along with all its other snapshots. Some care needs to be taken to make sure that the update uses the correct "Flag" setting. The chart is designed to remember which "Flag" setting it is using, so the updates are consistent unless you accidentally change the "flag" setting. A chart can contain as many snapshots as you like. When there are multiple '''Flag''' fields in a Microsoft Excel plan from which OnePager imports data, it’s a good idea to glance at the '''Flag''' setting before hitting the large '''New''' button. | |
| − | [[ | + | ==OnePager Bundle Add-in Push Update== |
| − | [[ | + | |
| − | [[ | + | OnePager Bundle '''Add-in''' supports '''ADDING a Snapshot using the Push Update''' for charts created from Microsoft Project or Microsoft Excel ''' source plans'''. The procedures and workflow for '''ADDING a Snapshot''' to these charts using the '''Push Update''' is the same as '''ADDING a Snapshot''' to charts originally created by OnePager Pro '''Add-in''' or OnePager Express '''Add-in'''. Accordingly, the instructions for '''ADDING a Snapshot''' to charts built from Microsoft Project or Microsoft Excel using the '''Push Update''' can be found at these two links respectively: |
| − | [[ | + | |
| − | [[Category: | + | <center> |
| − | [[Category: | + | {| class="wikitable" |
| − | [[Category: | + | | [[ADDING a Snapshot via Push Update to a OnePager Chart for Version 7.2#OnePager Pro Add-in Push Update | OnePager Pro Add-in Push Update]] 7.7.1-72 |
| + | |- | ||
| + | | [[ADDING a Snapshot via Push Update to a OnePager Chart for Version 7.2#OnePager Express Add-in Push Update | OnePager Express Add-in Push Update]] 7.7.1-72 | ||
| + | |} | ||
| + | </center> | ||
| + | |||
| + | ==OnePager Bundle Standalone Push Update== | ||
| + | |||
| + | OnePager Bundle '''Standalone''' supports '''ADDING a Snapshot''' to charts created originally from Microsoft Project, Microsoft Excel, Oracle Primavera P6, and Smartsheet '''source plans'''. | ||
| + | |||
| + | ===Using OnePager Bundle to ADD a Snapshot to Charts Created from Microsoft Project or Microsoft Excel using the Push Update=== | ||
| + | |||
| + | The '''procedures''' and workflow for '''ADDING a Snapshot''' to charts originally created from Microsoft Project or Microsoft Excel '''source plans''' is the same as '''push updating''' a chart originally created by OnePager Pro '''Standalone''' or OnePager Express '''Standalone'''. Accordingly, the instructions for '''Push Updating''' charts built from Microsoft Project or Microsoft Excel can be found at these two links respectively: | ||
| + | |||
| + | <center> | ||
| + | {| class="wikitable" | ||
| + | | [[ADDING a Snapshot via Push Update to a OnePager Chart for Version 7.2#OnePager Pro Standalone Push Update | OnePager Pro Standalone Push Update]] 7.7.1-72 | ||
| + | |- | ||
| + | | [[ADDING a Snapshot via Push Update to a OnePager Chart for Version 7.2#OnePager Express Standalone Push Update | OnePager Express Standalone Push Update]] 7.7.1-72 | ||
| + | |} | ||
| + | </center> | ||
| + | |||
| + | ===Using OnePager Bundle to ADD a Snapshot to Charts Created from Oracle Primavera P6 using the Push Update=== | ||
| + | |||
| + | The power of '''OnePager''' is illustrated when, after a period of progress on the project, it is time to produce another chart. '''OnePager''' produces your next snapshot with the same look and feel as the original assuming that the Oracle Primavera P6 '''source plan''' was updated with '''actual start and finish, percent complete''', and other relevant data during the reporting interval. '''OnePager''' can easily generate a new snapshot. | ||
| + | |||
| + | Suppose we have the original chart we created and we want to create another graph from the updated Oracle Primavera P6 '''source plan''' on later on in the project. A portion of the original chart is shown below: | ||
| + | |||
| + | <center>[[File:P71-3_0_3_1-71-(20-2)-10152021.png]]</center> | ||
| + | <!--<center>P71-3_0_3_1-71-(20-2)-10152021.png</center>--> | ||
| + | |||
| + | Before creating a new snapshot to show updates to the plan, we need to update the Oracle Primavera P6 '''source plan''' say by updating the '''Percent Complete''' for activities that have progressed to , say, 50%. When the '''source plan''' is updated with this revised information and '''exported''', we can proceed. Launch '''OnePager''' and click the '''UPDATE''' button on the '''OnePager Bundle Start''' form. Doing so accesses the following '''OnePager choices''' ('''OPC''') form shown here: | ||
| + | |||
| + | <center>[[File:P71-3_0_3_1-71-(20A-2)-02252022.png]]</center> | ||
| + | <!--<center>P71-3_0_3_1-71-(20A-2)-02252022.png</center>--> | ||
| + | |||
| + | In the '''OPC''' form, select the '''NEW snapshot at date:''' as shown above. You can also select a date for the snapshot so that this snapshot represents the project at the status date point in time. To see which snapshot dates already exist, just position your mouse over the '''NEW snapshot at date:''' window to see a list of the existing dates. | ||
| + | |||
| + | <center>[[File:P71-3_0_3_1-71-(20B-2)-02252022.png]]</center> | ||
| + | <!--<center>P71-3_0_3_1-71-(20B-2)-02252022.png</center>--> | ||
| + | |||
| + | You can use the built in calendar dropdown or type in the new snapshot’s month, day, and year in the window provided as shown below: | ||
| + | |||
| + | <center>[[File:P71-3_0_3_1-71-(20C-2)-02252022.png]]</center> | ||
| + | <!--<center>P71-3_0_3_1-71-(20C-2)-02252022.png</center>--> | ||
| + | |||
| + | Un-check the '''Show field mappings''' checkbox '''OFF''' if you want to use the same '''field mappings''' as you used before. The bottom of the screen now looks like this: | ||
| + | |||
| + | <center>[[File:P71-3_0_3_1-71-(26)-06072021.png]]</center> | ||
| + | <!--<center>P71-3_0_3_1-71-(26)-06072021.png</center>--> | ||
| + | |||
| + | Pressing the large '''New''' button creates a new snapshot for the chart. The chart opens at the new snapshot. The '''color''', '''fonts''', '''title''', and '''swimlane''' assignments are consistent between the two snapshots: | ||
| + | |||
| + | <center>[[File:P71-3_0_3_1-71-(20D)-06072021.png]]</center> | ||
| + | <!--<center>P71-3_0_3_1-71-(20D)-06072021.png</center>--> | ||
| + | |||
| + | You can go back and forth between the two snapshots by using the '''snapshot forward/backward''' buttons on the '''View''' ribbon tool bar tab as shown below: | ||
| + | |||
| + | <center>[[File:P71-3_0_3_1-71-(20E-1)-10152021.png]]</center> | ||
| + | <!--<center>P71-3_0_3_1-71-(20E-1)-10152021.png</center>--> | ||
| + | |||
| + | ===Using OnePager Bundle to ADD a Snapshot to Charts Created from Smartsheet using the Push Update=== | ||
| + | |||
| + | The power of '''OnePager''' is illustrated when, after a period of progress on the project, it is time to produce another chart. '''OnePager''' produces your next snapshot with the same look and feel as the original assuming that the Smartsheet '''source plan''' was updated with '''actual start and finish, percent complete''', and other relevant data during the reporting interval, '''OnePager''' can easily generate a new snapshot. | ||
| + | |||
| + | Suppose we have the original chart we created and we want to create another graph from the updated Smartsheet '''source plan''' on later on in the project. The original chart is shown below: | ||
| + | |||
| + | <center>[[File:P71-3_0_3_3-71-(11A-2)-10282021.png]]</center> | ||
| + | <!--<center>P71-3_0_3_3-71-(11A-2)-10282021.png</center>--> | ||
| + | |||
| + | Before creating a new snapshot to show updates to the plan, we need to update the Smartsheet '''source plan''' say by updating the '''Percent Complete''' for tasks that have progressed to , say, 95%. After the Smartsheet '''source plan''' is updated, it looks like this | ||
| + | |||
| + | <center>[[File:P71-3_0_3_3-71-(11B-1)-06102021.png]]</center> | ||
| + | <!--<center>P71-3_0_3_3-71-(11B-1)-06102021.png</center>--> | ||
| + | |||
| + | When the '''source plan''' is updated with this revised information, we can proceed. Launch '''OnePager''' and click the '''UPDATE''' button on the '''OnePager Bundle Start''' form. Doing so accesses the following '''OnePager choices''' ('''OPC''') form shown here: | ||
| + | |||
| + | <center>[[File:P71-3_0_3_3-71-(20A-2)-12062021.png]]</center> | ||
| + | <!--<center>P71-3_0_3_3-71-(20A-2)-12062021.png</center>--> | ||
| + | |||
| + | In the '''OPC''' form select the '''NEW snapshot at date:''' as shown above. You can also select a date for the snapshot so that this snapshot represents the project at the status date point in time. To see which snapshot dates already exist, just position your mouse over the '''NEW snapshot at date:''' window to see a list of the existing dates. | ||
| + | |||
| + | <center>[[File:P71-3_0_3_3-71-(20B-2)-12062021.png]]</center> | ||
| + | <!--<center>P71-3_0_3_3-71-(20B-2)-12062021.png</center>--> | ||
| + | |||
| + | You can use the built in calendar dropdown or type in the new snapshot’s month, day, and year in the window provided as shown below: | ||
| + | |||
| + | <center>[[File:P71-3_0_3_3-71-(20C-2)-12062021.png]]</center> | ||
| + | <!--<center>P71-3_0_3_3-71-(20C-2)-12062021.png</center>--> | ||
| + | |||
| + | Un-check the '''Show field mappings''' checkbox '''OFF''' if you want to use the same '''field mappings''' as you used before. The bottom of the screen now looks like this: | ||
| + | |||
| + | <center>[[File:P71-3_0_3_1-71-(26)-06072021.png]]</center> | ||
| + | <!--<center>P71-3_0_3_1-71-(26)-06072021.png</center>--> | ||
| + | |||
| + | Pressing the large '''New''' button creates a new snapshot for the chart. The chart opens at the new snapshot. The '''color''', '''fonts''', '''title''', and '''swimlane''' assignments are consistent between the two snapshots: | ||
| + | |||
| + | <center>[[File:P71-3_0_3_3-71-(20D-1)-06102021.png]]</center> | ||
| + | <!--<center>P71-3_0_3_3-71-(20D-1)-06102021.png</center>--> | ||
| + | |||
| + | You can go back and forth between the two snapshots by using the '''snapshot forward/backward''' buttons on the '''View''' ribbon tool bar tab as shown below: | ||
| + | |||
| + | <center>[[File:P71-3_0_3_3-71-(20E-2)-10282021.png]]</center> | ||
| + | <!--<center>P71-3_0_3_3-71-(20E-2)-10282021.png</center>--> | ||
| + | |||
| + | ==Related Links== | ||
| + | |||
| + | [[Using Microsoft Project/Excel Source Plans with OnePager Bundle Version 7.2 | Using Microsoft Project/Excel Source Plans with OnePager Bundle]] 3.0.3.2-72 | ||
| + | |||
| + | [[Using Oracle Primavera P6 Source Plans with OnePager Version 7.2 | Using Oracle Primavera P6 Source Plans with OnePager]] 3.0.3.1-72 | ||
| + | |||
| + | [[Using Smartsheet Source Plans with OnePager Version 7.2 | Using Smartsheet Source Plans with OnePager]] 3.0.3.3-72 | ||
| + | |||
| + | [[Creating a NEW Chart via Pull Operation Feature for Version 7.1 | Creating a NEW Chart via Pull Operation Feature]] 7.13.1-71 | ||
| + | |||
| + | [[REPLACING a Snapshot via Pull Operation for Version 7.1 | REPLACING a Snapshot via Pull Operation]] 7.14.1-71 | ||
| + | |||
| + | [[ADDING a Snapshot via Pull Operation for Version 7.1 | ADDING a Snapshot via Pull Operation]] 7.15.1-71 | ||
| + | |||
| + | [[Custom Update (Replacing) of a Snapshot via Pull Operation for Version 7.1 | Custom Update (Replacing) of a Snapshot via Pull Operation]] 7.16.1-71 | ||
| + | |||
| + | [[Using the OnePager "Data" Tab's "Selected file(s)" Button for Version 7.1 | Using the OnePager "Data" Tab's "Selected file(s)" Button]] 7.17.1-71 | ||
| + | |||
| + | (7.7.1-72) | ||
| + | |||
| + | [[Category:Version 7.2]] | ||
| + | [[Category:Add-in]] | ||
| + | [[Category:Standalone]] | ||
| + | [[Category:Basic Workflows]] | ||
| + | [[Category:Template Properties Form]] | ||
| + | [[Category:Chart Properties Form]] | ||
| + | [[Category:OnePager Choices Form]] | ||
[[Category:Snapshots]] | [[Category:Snapshots]] | ||
| − | [[Category:Project | + | [[Category:Charts]] |
| − | [[Category: | + | [[Category:Microsoft Project]] |
| − | [[Category: | + | [[Category:Microsoft Excel]] |
| − | [[Category: | + | [[Category:Smartsheet]] |
| + | [[Category:Oracle Primavera P6]] | ||
| + | [[Category:OnePager Pro]] | ||
| + | [[Category:OnePager Express]] | ||
| + | [[Category:OnePager Bundle]] | ||
Revision as of 16:10, 31 May 2022
Contents
- 1 Introduction
- 2 OnePager Pro Add-in Push Update
- 3 OnePager Pro Standalone Push Update
- 4 OnePager Express Add-in Push Update
- 5 OnePager Express Standalone Push Update
- 6 OnePager Bundle Add-in Push Update
- 7 OnePager Bundle Standalone Push Update
- 7.1 Using OnePager Bundle to ADD a Snapshot to Charts Created from Microsoft Project or Microsoft Excel using the Push Update
- 7.2 Using OnePager Bundle to ADD a Snapshot to Charts Created from Oracle Primavera P6 using the Push Update
- 7.3 Using OnePager Bundle to ADD a Snapshot to Charts Created from Smartsheet using the Push Update
- 8 Related Links
Introduction
This article has six (6) major sections below. The first and second major sections are associated with OnePager Pro Add-in and Standalone, respectively. The third and fourth major sections are are associated with OnePager Express Add-in and Standalone, respectively. The last two major sections are for OnePager Bundle users. These last two section direct you to the appropriate portions of this article where you can find the instructions for ADDING a Snapshot to a chart previously created from any one of the source plans supported by OnePager Bundle (i.e., Microsoft Project, Microsoft Excel, Oracle Primavera P6, or Smartsheet).
Please use the table below to accesses the desired sub-section:
| OnePager Pro Add-in Push Update 7.7.1-72 |
| OnePager Pro Standalone Push Update 7.7.1-72 |
| OnePager Express Add-in Push Update 7.7.1-72 |
| OnePager Express Standalone Push Update 7.7.1-72 |
| OnePager Bundle Add-in Push Update 7.7.1-72 |
| OnePager Bundle Standalone Push Update 7.7.1-72 |
OnePager Pro Add-in Push Update
During the course of a project, work is accomplished, new tasks start, other tasks finish, and, from time to time, dates are adjusted. These changes are usually picked up as part of a regular reporting process. When updated, the Microsoft Project source plan becomes the source for reporting schedule updates.
OnePager uses the updated Microsoft Project source plan to add snapshots to record how the project progresses between reporting periods. One method that the OnePager Add-in uses is called the Push Update. By push we mean that the updated Microsoft Project source plan is Pushed to OnePager Pro.
This distinction is important since OnePager also enables the Pull Update method where OnePager Pro loads the updated source plan file before processing the updates.
For more information on the Pull method of adding a snapshot to the chart, please see the article at: ADDING a Snapshot via Pull Operation 7.15.1-72
The workflow for accomplishing this periodic process is shown below:
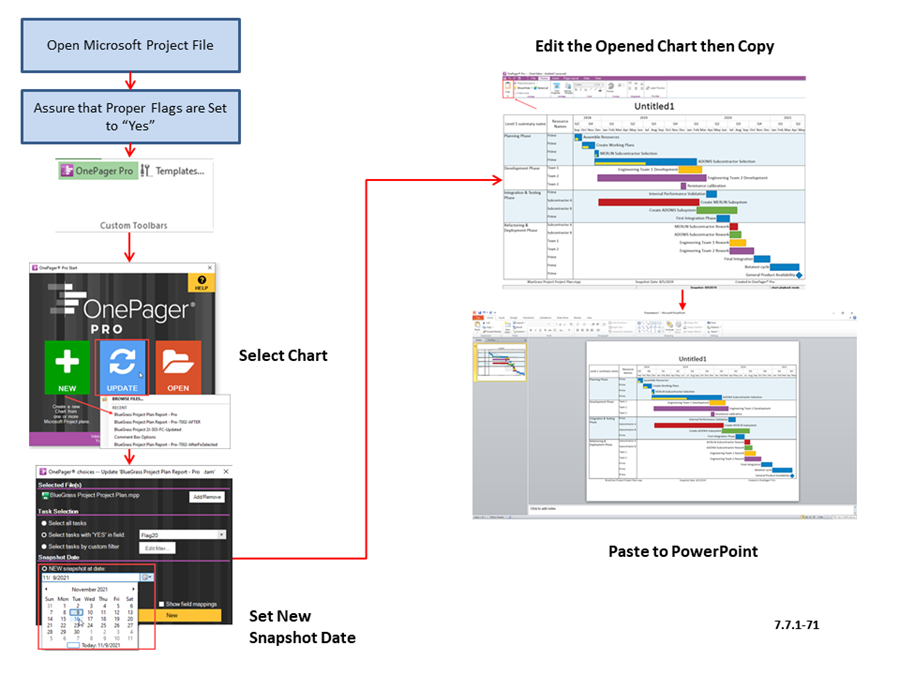
- 1) Launch Microsoft Project and access a Microsoft Project source plan containing updated information.
- 2) Launch OnePager Pro from the Microsoft Project ADD-IN ribbon tool bar tab.
- 3) Select the UPDATE button on the OnePager Pro Start form as shown below:
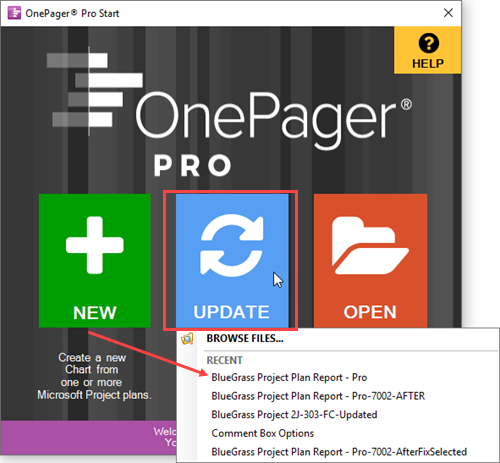
- 4) Clicking the UPDATE button displays a list of recently-used charts and the word BROWSE FILES… option. Select the desired chart as shown above and OnePager accesses the OnePager choices (OPC) form shown here:
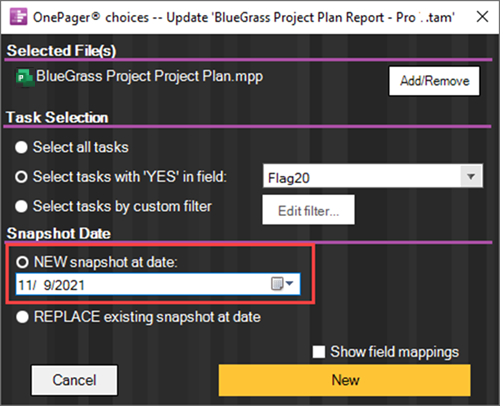
- 5) Select the NEW snapshot at date: radio button and use the calendar dropdown list to select the date for this snapshot as shown here:
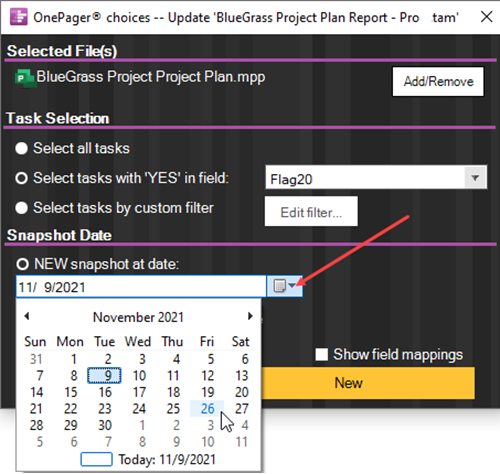
- 6) Then, click Next> or New depending on whether the Show field mappings checkbox is checked ON. OnePager takes the Microsoft Project source plan data under the control of the Flag/Number field and produce a new snapshot in the chart at the date selected.
Once the updated chart is open, you can edit, save, and copy the chart to a Microsoft PowerPoint slide or elsewhere as described previously. When you save the chart, the newly created snapshot is stored in the chart’s .TAM file along with all its other snapshots. Some care needs to be taken to make sure that the update uses the correct Flag setting. A chart can contain as many snapshots as you like. The chart is designed to remember which Flag setting, so the updates are consistent unless you accidentally change the Flag. When there are multiple Flag/Number fields in a Microsoft Project source plan from which OnePager imports data, it’s a good idea to glance at the Flag setting before hitting the large New button.
OnePager Pro Standalone Push Update
During the course of a project, work is accomplished, new tasks start, other tasks finish, and, from time to time, dates are adjusted. These changes are usually picked up as part of a regular reporting process. When updated, the Microsoft Project source plan becomes the source for reporting schedule updates.
OnePager uses the updated Microsoft Project source plan to add snapshots to record how the project progresses between reporting periods. Once charts are created, they can be updated from the OnePager Pro Start form by launching OnePager from the Standalone Icon and doing a Push Update. By push we mean that the updated Microsoft Project source plan is Pushed to OnePager. This distinction is important since OnePager also enables the Pull Update method.
For more information on the Pull method for adding a snapshot to the chart, please see the article at: ADDING a Snapshot via Pull Operation 7.15.1-72
The workflow for accomplishing this periodic process is shown below:
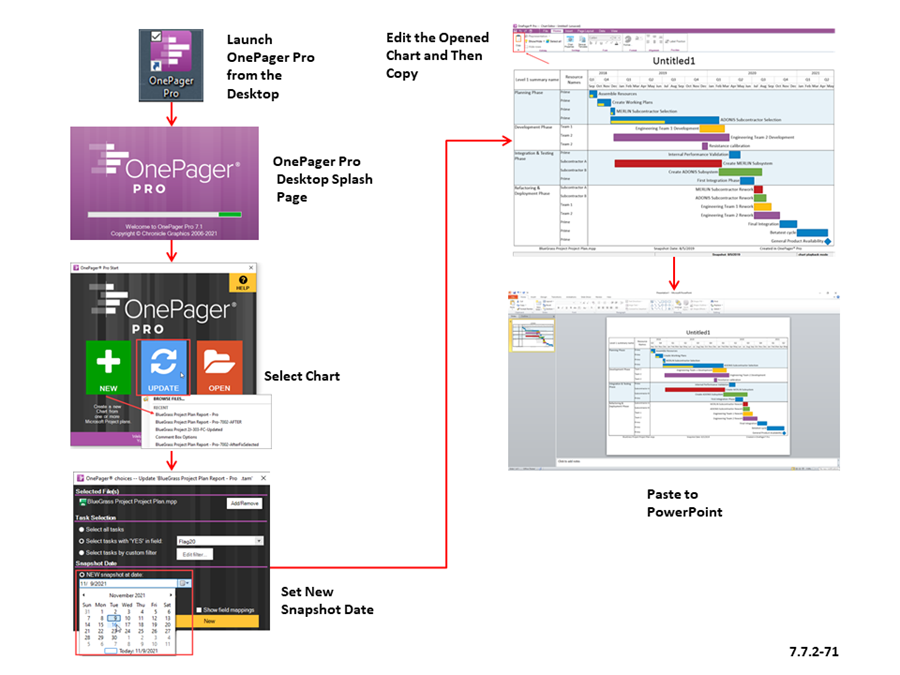
- 1) Launch OnePager from the Standalone Icon.
- 2) The splash page appears briefly followed by the One Pager Chart Editor form displaying the OnePager Pro Start form.
- 3) Select the UPDATE button on the OnePager Pro Start form as shown below:
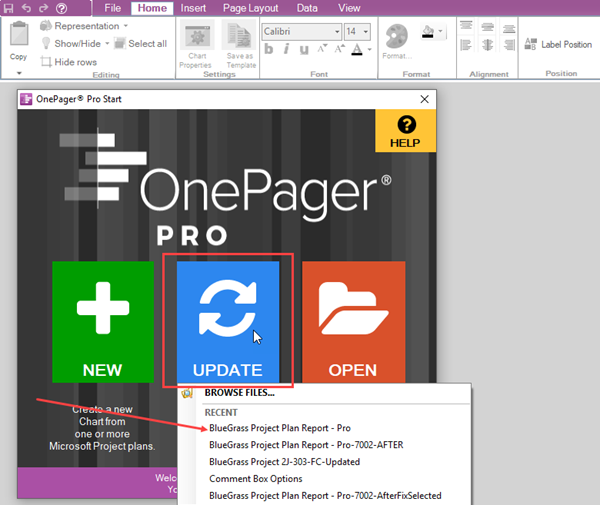
- 4) Clicking the UPDATE button displays a list of recently-used charts and the word BROWSE FILES… option. Select the desired chart as shown above and OnePager accesses the OnePager choices (OPC) form shown here:
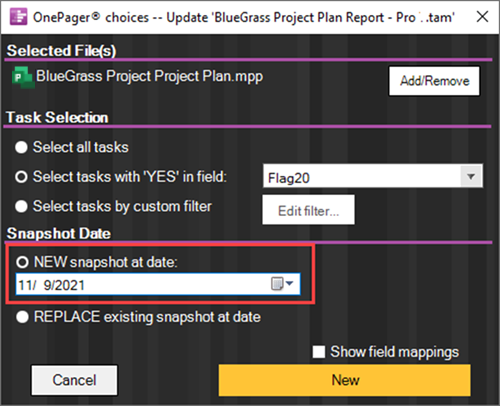
- 5) Select the NEW snapshot at date: radio button and use the calendar dropdown list to select the date for this snapshot as shown here:
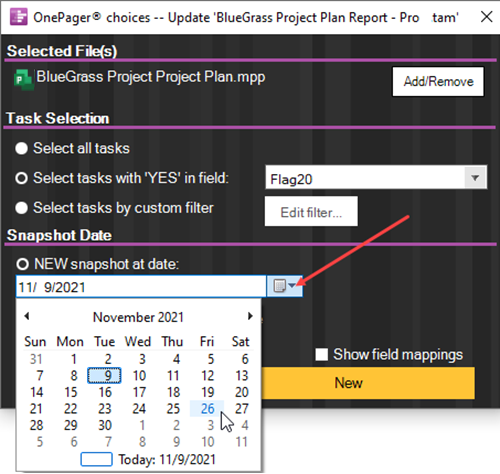
- 6) Then, click Next> or New depending on whether the Show column mappings checkbox is checked ON.
- 7) OnePager takes the Microsoft Project source plan data under the control of the Flag/Number field and produce a new snapshot in the chart at the date selected.
Once the updated chart is open, you can edit, save, and copy the chart to a Microsoft PowerPoint slide or elsewhere as described previously. When you save the chart, the newly created snapshot is stored in the chart’s .TAM file along with all its other snapshots. Some care needs to be taken to make sure that the update uses the correct Flag setting. The chart is designed to remember which Flag setting, so the updates are consistent unless you accidentally change the Flag. A chart can contain as many snapshots as you like. When there are multiple Flag/Number fields in a Microsoft Project plan from which OnePager imports data, it’s a good idea to glance at the Flag setting before hitting the large New button.
OnePager Express Add-in Push Update
During the course of a project, work is accomplished, new tasks start, other tasks are finished, and, from time to time, dates are adjusted. These occurrences are usually picked up as part of a regular reporting process. When updated, the Microsoft Excel plan becomes the source for reporting schedule updates. OnePager uses the updated Microsoft Excel source plan to add snapshots to record how the project changes from reporting period to reporting period.
One method that the OnePager Add-in uses is called the Push Update. By push we mean that the updated Microsoft Excel plan is Pushed to OnePager. This distinction is important since OnePager also enables the Pull Update method.
For more information on the Pull method for adding a snapshot to the chart, please see the article at: ADDING a Snapshot via Pull Operation 7.15.1-72
The workflow for accomplishing this periodic process is shown below:
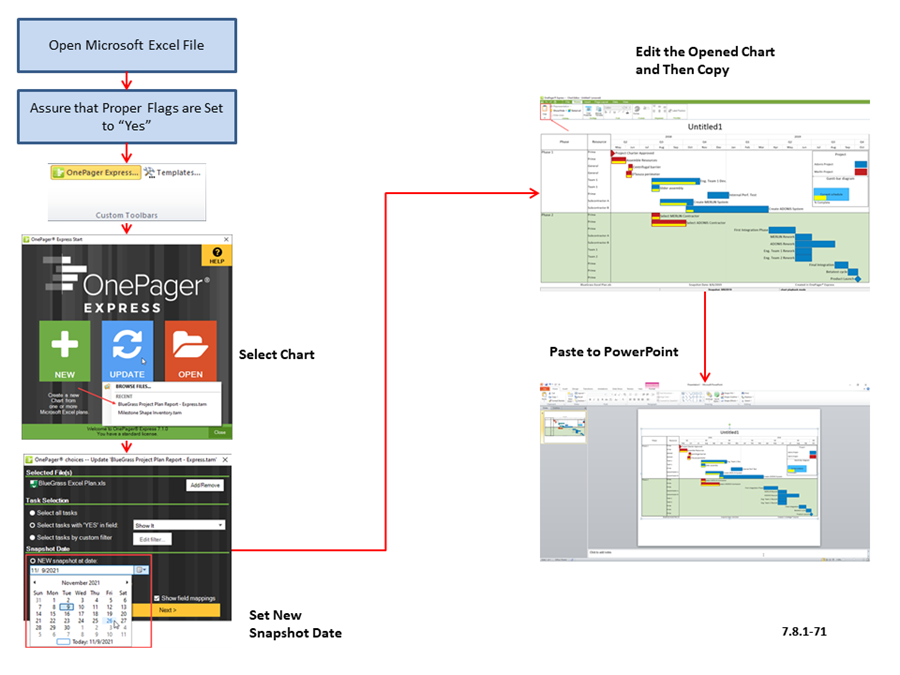
- 1) Launch Microsoft Excel and bring up a Microsoft Excel source plan containing updated information. Launch OnePager Express from the Microsoft Excel tool bar.
- 2) Launch OnePager and select the UPDATE button on the OnePager Express Start form as shown below:
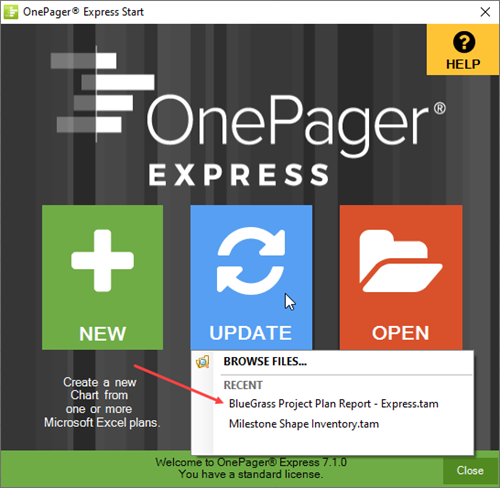
- 3) Clicking the UPDATE button displays a list of recently-used charts and the word BROWSE FILES… option. Select the desired chart as shown above and OnePager accesses the OnePager choices (OPC) form shown here:
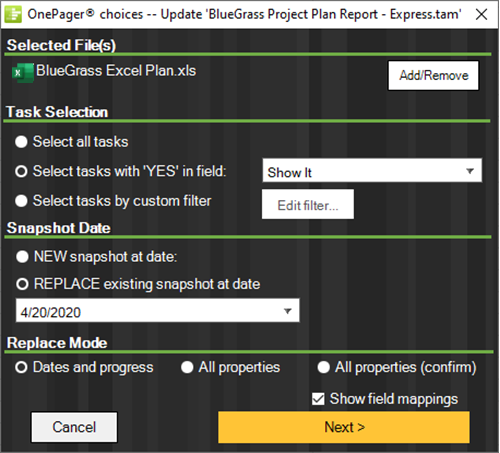
- 4) Select the NEW snapshot at date: radio button and use the calendar dropdown list to select the date for this snapshot as shown here:
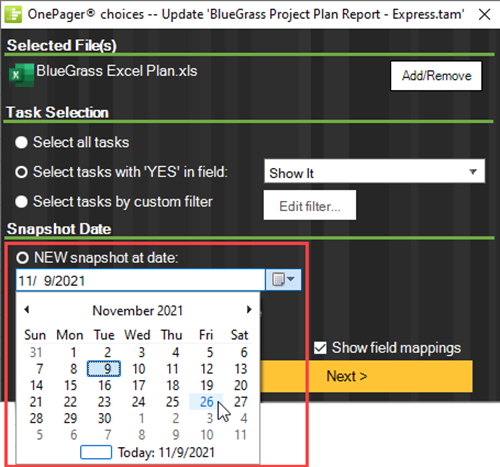
- 5) Then, click Next> or New depending on whether the Show field mappings box is checked. OnePager takes the Microsoft Excel source plan data under the control of the flag field and produce a new snapshot in the chart at the date selected.
Once the updated chart is open, you can edit, save, and copy the chart to a Microsoft PowerPoint slide or elsewhere as described previously. When you save the chart, the newly created snapshot is stored in the chart’s .TAM file along with all its other snapshots. Some care needs to be taken to make sure that the update uses the correct Flag setting. The chart is designed to remember which Flag setting, so the updates are consistent unless you accidentally change the Flag. A chart can contain as many snapshots as you like. When there are multiple Flag fields in a Microsoft Excel plan from which OnePager imports data, it’s a good idea to glance at the Flag setting before hitting the large New button.
OnePager Express Standalone Push Update
During the course of a project, work is accomplished, new tasks start, other tasks are finished, and, from time to time, dates are adjusted. These occurrences are usually picked up as part of a regular reporting process. When updated, the Microsoft Excel plan becomes the source for reporting schedule updates.
OnePager uses the updated Microsoft Excel source plan to add snapshots to record how the project changes from reporting period to reporting period. Once project views are created, they can be updated from the OnePager Express Start form by launching OnePager from the desktop icon and doing a push update. By push we mean that the updated Microsoft Excel plan is Pushed to OnePager. This distinction is important since OnePager also enables the Pull Update method.
For more information on the Pull method for adding a snapshot to the chart, please see the article at: ADDING a Snapshot via Pull Operation 7.15.1-72
The workflow for accomplishing this periodic process is shown below:
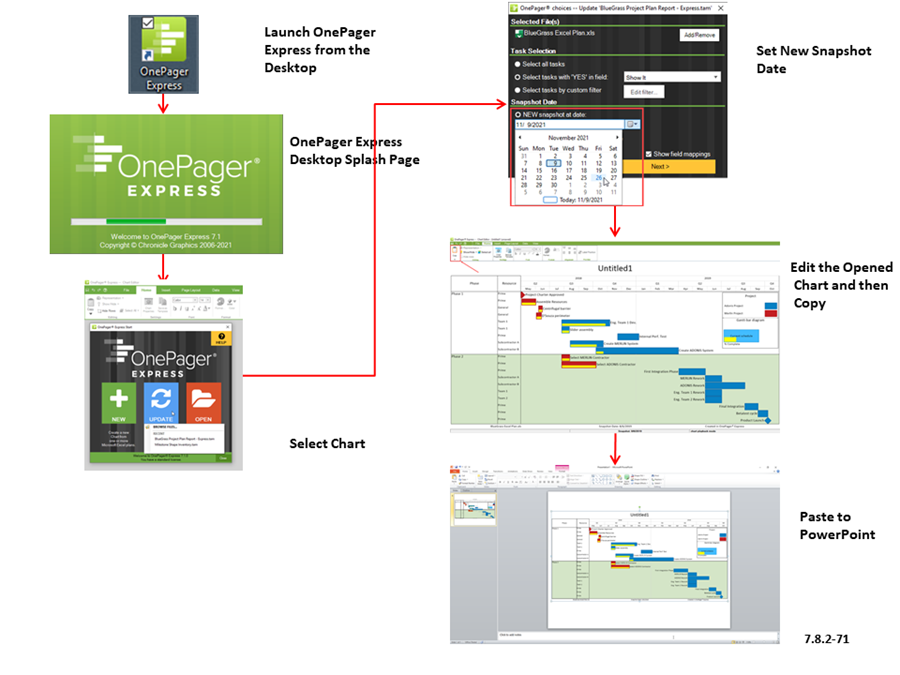
- 1) Launch OnePager from the desktop icon.
- 2) The splash page appears briefly followed by the One Pager Project View Editor (PVE) form displaying the OnePager Express Start form.
- 3) Select the UPDATE button on the OnePager Express Start form as shown below:
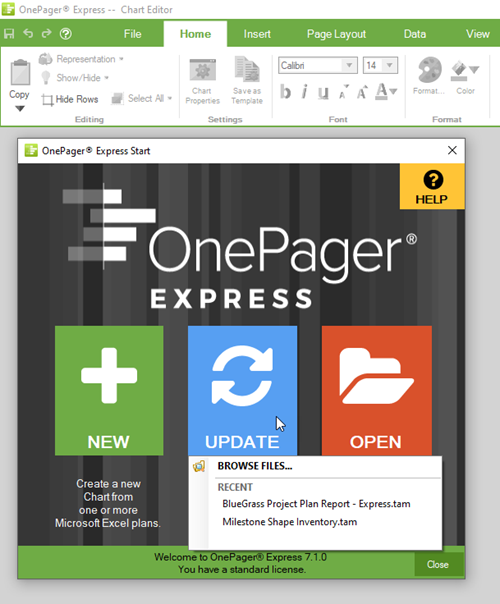
- 4) Clicking the UPDATE button displays a list of recently-used project views and the word BROWSE FILES… option. Select the desired project view as shown above and OnePager accesses the OnePager choices (OPC) form shown here:

- 5) Select the NEW snapshot at date: radio button and use the calendar dropdown list to select the date for this snapshot as shown here:

- 6) Then, click Next> or New depending on whether the Show field mappings box is checked. OnePager takes the Microsoft Excel plan data under the control of the flag field and produce a new snapshot in the project view at the date selected.
Once the updated project view is open, you can edit, save, and copy the chart to a Microsoft PowerPoint slide or elsewhere as described previously. When you save the project view, the newly created snapshot is stored in the project view’s .TAM file along with all its other snapshots. Some care needs to be taken to make sure that the update uses the correct "Flag" setting. The chart is designed to remember which "Flag" setting it is using, so the updates are consistent unless you accidentally change the "flag" setting. A chart can contain as many snapshots as you like. When there are multiple Flag fields in a Microsoft Excel plan from which OnePager imports data, it’s a good idea to glance at the Flag setting before hitting the large New button.
OnePager Bundle Add-in Push Update
OnePager Bundle Add-in supports ADDING a Snapshot using the Push Update for charts created from Microsoft Project or Microsoft Excel source plans. The procedures and workflow for ADDING a Snapshot to these charts using the Push Update is the same as ADDING a Snapshot to charts originally created by OnePager Pro Add-in or OnePager Express Add-in. Accordingly, the instructions for ADDING a Snapshot to charts built from Microsoft Project or Microsoft Excel using the Push Update can be found at these two links respectively:
| OnePager Pro Add-in Push Update 7.7.1-72 |
| OnePager Express Add-in Push Update 7.7.1-72 |
OnePager Bundle Standalone Push Update
OnePager Bundle Standalone supports ADDING a Snapshot to charts created originally from Microsoft Project, Microsoft Excel, Oracle Primavera P6, and Smartsheet source plans.
Using OnePager Bundle to ADD a Snapshot to Charts Created from Microsoft Project or Microsoft Excel using the Push Update
The procedures and workflow for ADDING a Snapshot to charts originally created from Microsoft Project or Microsoft Excel source plans is the same as push updating a chart originally created by OnePager Pro Standalone or OnePager Express Standalone. Accordingly, the instructions for Push Updating charts built from Microsoft Project or Microsoft Excel can be found at these two links respectively:
| OnePager Pro Standalone Push Update 7.7.1-72 |
| OnePager Express Standalone Push Update 7.7.1-72 |
Using OnePager Bundle to ADD a Snapshot to Charts Created from Oracle Primavera P6 using the Push Update
The power of OnePager is illustrated when, after a period of progress on the project, it is time to produce another chart. OnePager produces your next snapshot with the same look and feel as the original assuming that the Oracle Primavera P6 source plan was updated with actual start and finish, percent complete, and other relevant data during the reporting interval. OnePager can easily generate a new snapshot.
Suppose we have the original chart we created and we want to create another graph from the updated Oracle Primavera P6 source plan on later on in the project. A portion of the original chart is shown below:
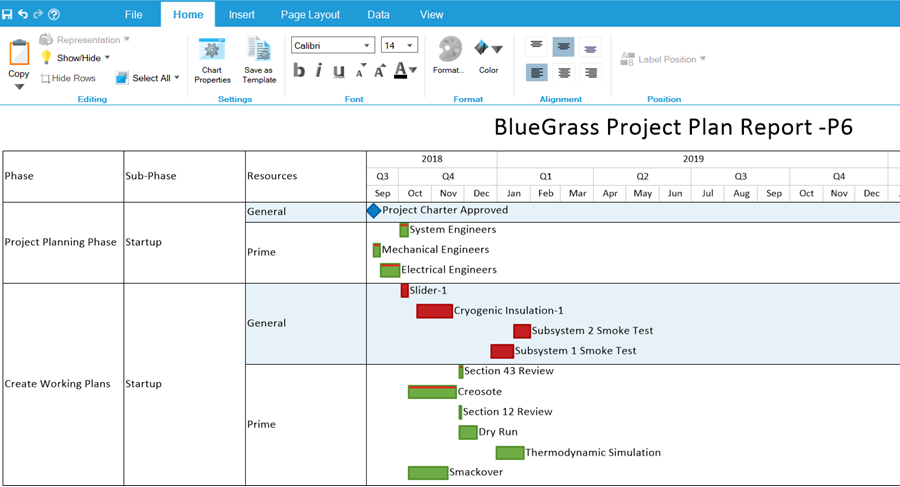
Before creating a new snapshot to show updates to the plan, we need to update the Oracle Primavera P6 source plan say by updating the Percent Complete for activities that have progressed to , say, 50%. When the source plan is updated with this revised information and exported, we can proceed. Launch OnePager and click the UPDATE button on the OnePager Bundle Start form. Doing so accesses the following OnePager choices (OPC) form shown here:
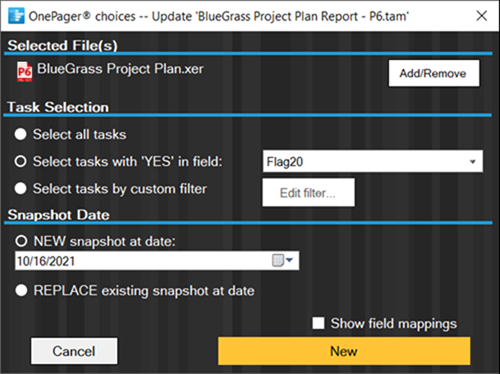
In the OPC form, select the NEW snapshot at date: as shown above. You can also select a date for the snapshot so that this snapshot represents the project at the status date point in time. To see which snapshot dates already exist, just position your mouse over the NEW snapshot at date: window to see a list of the existing dates.
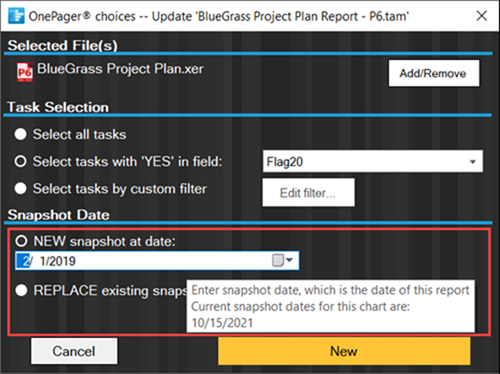
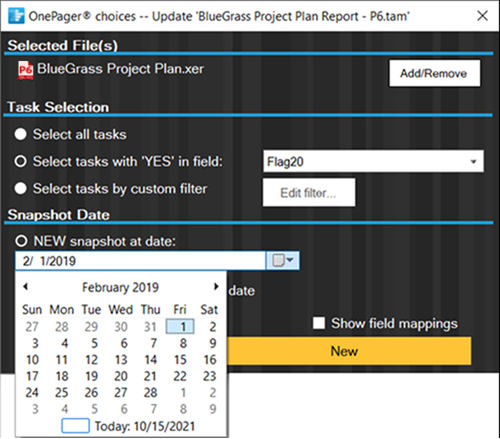
You can use the built in calendar dropdown or type in the new snapshot’s month, day, and year in the window provided as shown below:
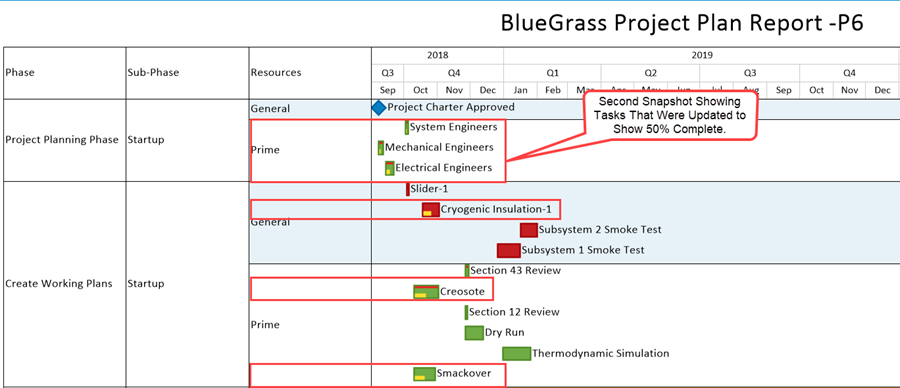
Un-check the Show field mappings checkbox OFF if you want to use the same field mappings as you used before. The bottom of the screen now looks like this:

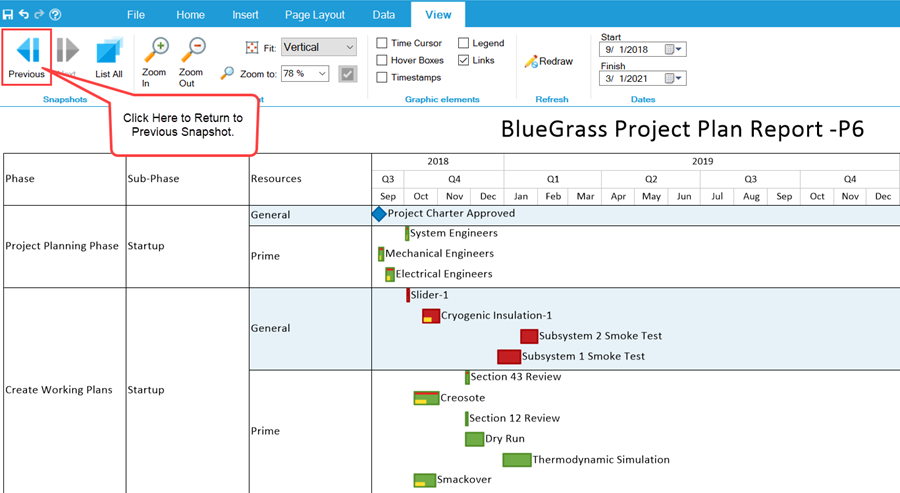
Pressing the large New button creates a new snapshot for the chart. The chart opens at the new snapshot. The color, fonts, title, and swimlane assignments are consistent between the two snapshots:
You can go back and forth between the two snapshots by using the snapshot forward/backward buttons on the View ribbon tool bar tab as shown below:
Using OnePager Bundle to ADD a Snapshot to Charts Created from Smartsheet using the Push Update
The power of OnePager is illustrated when, after a period of progress on the project, it is time to produce another chart. OnePager produces your next snapshot with the same look and feel as the original assuming that the Smartsheet source plan was updated with actual start and finish, percent complete, and other relevant data during the reporting interval, OnePager can easily generate a new snapshot.
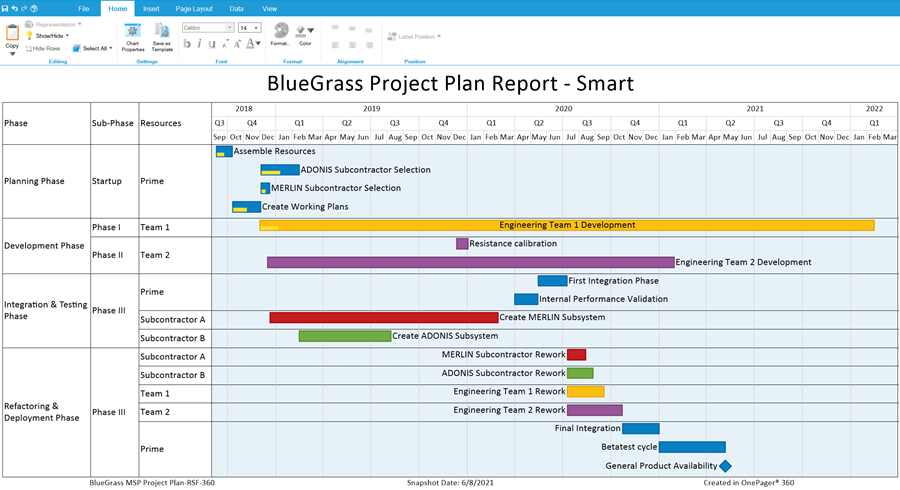
Suppose we have the original chart we created and we want to create another graph from the updated Smartsheet source plan on later on in the project. The original chart is shown below:
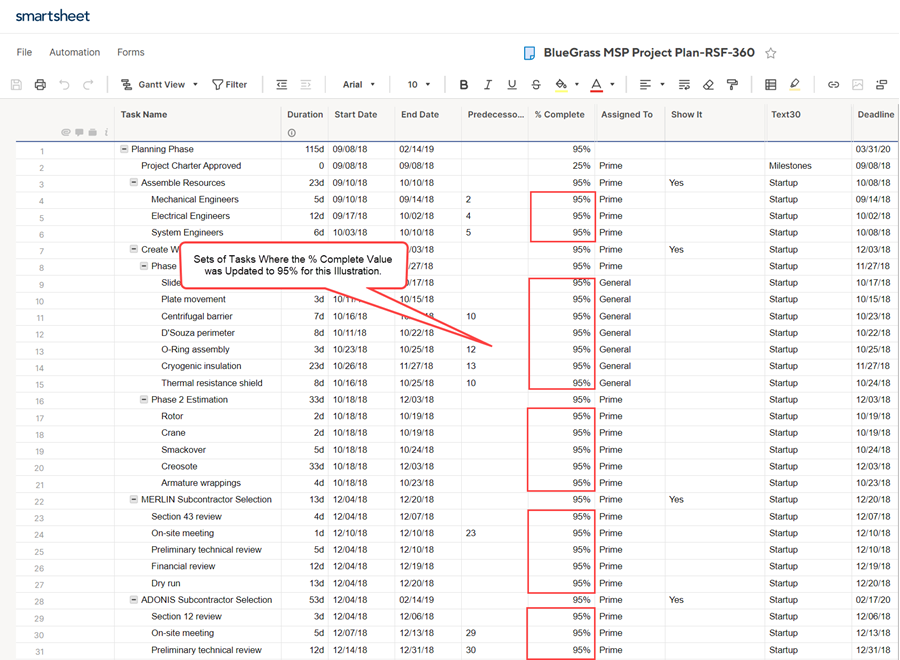
Before creating a new snapshot to show updates to the plan, we need to update the Smartsheet source plan say by updating the Percent Complete for tasks that have progressed to , say, 95%. After the Smartsheet source plan is updated, it looks like this
When the source plan is updated with this revised information, we can proceed. Launch OnePager and click the UPDATE button on the OnePager Bundle Start form. Doing so accesses the following OnePager choices (OPC) form shown here:
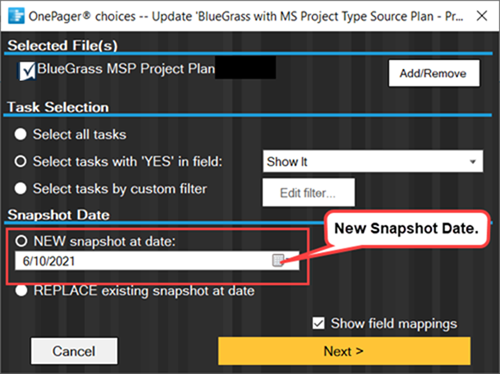
In the OPC form select the NEW snapshot at date: as shown above. You can also select a date for the snapshot so that this snapshot represents the project at the status date point in time. To see which snapshot dates already exist, just position your mouse over the NEW snapshot at date: window to see a list of the existing dates.
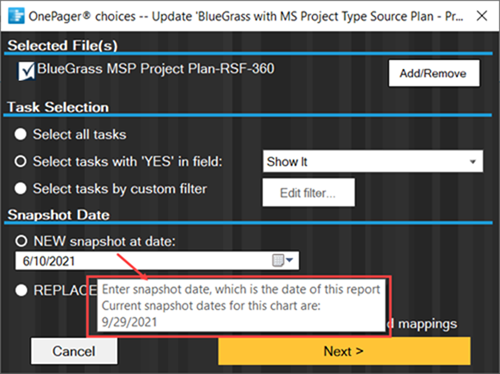
You can use the built in calendar dropdown or type in the new snapshot’s month, day, and year in the window provided as shown below:
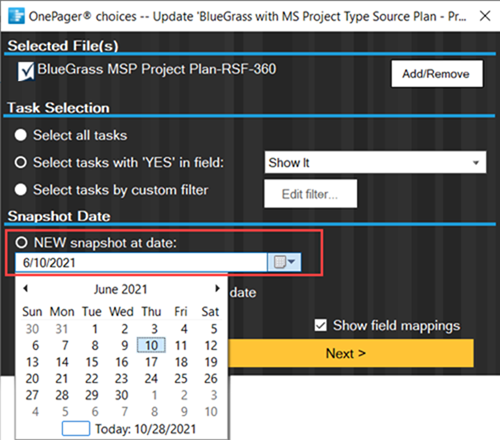
Un-check the Show field mappings checkbox OFF if you want to use the same field mappings as you used before. The bottom of the screen now looks like this:

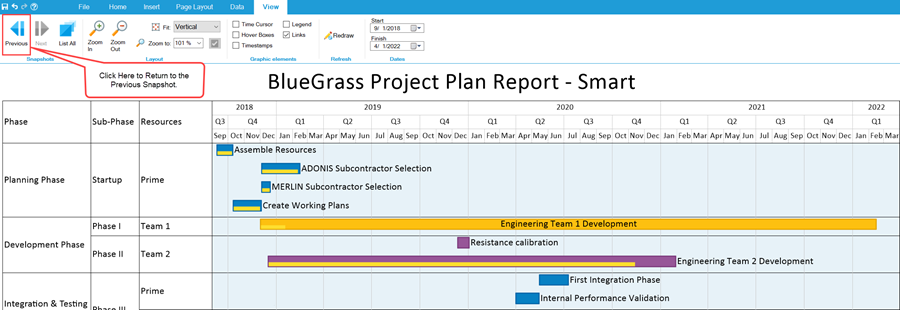
Pressing the large New button creates a new snapshot for the chart. The chart opens at the new snapshot. The color, fonts, title, and swimlane assignments are consistent between the two snapshots:

You can go back and forth between the two snapshots by using the snapshot forward/backward buttons on the View ribbon tool bar tab as shown below:
Related Links
Using Microsoft Project/Excel Source Plans with OnePager Bundle 3.0.3.2-72
Using Oracle Primavera P6 Source Plans with OnePager 3.0.3.1-72
Using Smartsheet Source Plans with OnePager 3.0.3.3-72
Creating a NEW Chart via Pull Operation Feature 7.13.1-71
REPLACING a Snapshot via Pull Operation 7.14.1-71
ADDING a Snapshot via Pull Operation 7.15.1-71
Custom Update (Replacing) of a Snapshot via Pull Operation 7.16.1-71
Using the OnePager "Data" Tab's "Selected file(s)" Button 7.17.1-71
(7.7.1-72)