Getting Started with OnePager Express
Contents
- 1 OnePager Express Icons
- 2 Step 1: Preparing Your Microsoft Excel Plan for OnePager Express
- 3 Step 2: Launch OnePager Express
- 4 A Note
- 5 Step 3: Create a NEW Project View
- 6 Step 4: OPEN an Existing Project View
- 7 Step 5: UPDATE a Project View
- 8 Step 6: Edit Your Project View
- 9 Step 7: Share Your Project View
OnePager Express Icons
OnePager is an add-in to Microsoft Excel, which automatically displays the “OnePager” icon once OnePager is installed. That tool bar looks like this:
Clicking the “OnePager” icon button will generate the graph. Clicking the “Templates…” button will let you edit the templates for your graphs. For now, it is simplest to use the default template, but you can learn how templates let you customize and standardize graph features later in this document.
Step 1: Preparing Your Microsoft Excel Plan for OnePager Express
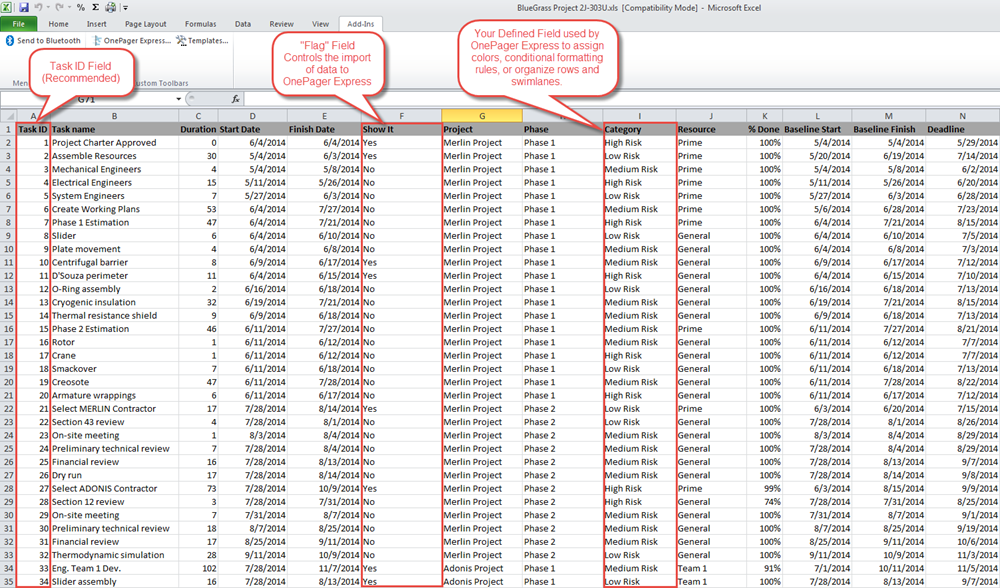
Before you launch OnePager Express, however, you must have certain scheduling columns in your Microsoft Excel spreadsheet. There is a lot of flexibility in how these columns can be named, but a typical example is shown below. The only mandatory columns are columns representing Start, Finish, and Name. In this example, however, we are also including two optional columns:
- a) A category column (“Category”) that we will use to assign colors to tasks
- b) A selection column (“Show It”) that we will use to choose which tasks to graph.
- c) A “Task ID” field that OnePager will use to keep track of tasks/milestones as your Microsoft Excel plan is change through additions or deletions over the course of the project.
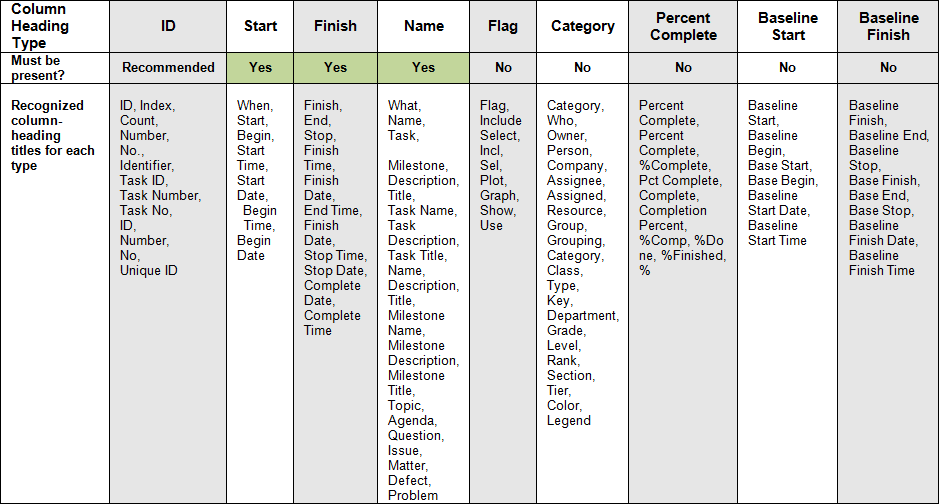
The following table describes column-heading types that OnePager Express uses and shows variations on the heading titles that OnePager will recognize. It is not mandatory that you used these column names, since OnePager Express gives you a chance to choose the actual Microsoft Excel plan columns that it will employ. However, using these names will speed things up because it will help OnePager Express make reasonable guesses on which columns to use as its default selections. Note that it shows that three of the column heading types must always be present: Name, Start, and Finish. Also, we recommend the inclusion of an ID field with sequential numbering from top to bottom. This assists OnePager maintain a correspondence with Microsoft Excel’s rows after the Microsoft Excel plan is updated.
Please note that OnePager Express is shipped with a number of fully populated templates that are based on the Microsoft Excel plan used in the Tutorial also shipped with the product – BlueGrass Project 2J-303.
Step 2: Launch OnePager Express
To launch OnePager Express and make a graph, click on the “OnePager Express” button on the tool bar, which brings up the “OnePager Start” form:
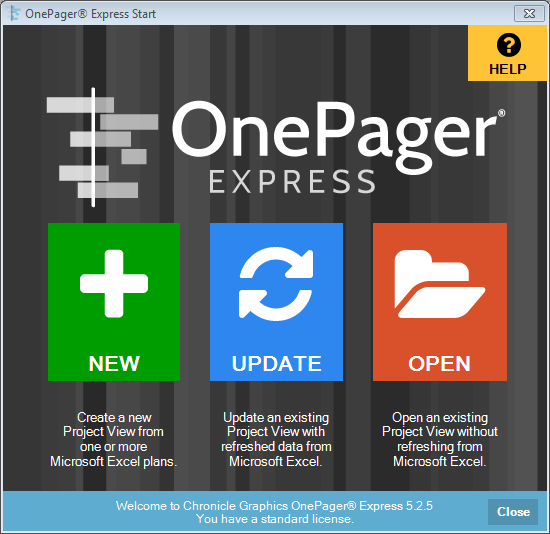
The “OnePager Express Start” form provides you with three options:
- a) NEW: Clicking the “NEW” button will bring up the “OnePager Express choices” form for creating a new project view.
- b) UPDATE: Clicking the “UPDATE” button will allow you to BROWSE for an existing project view file or select a recently-opened project view file so that you can add or replace a snapshot in it.
- c) OPEN: Clicking the “OPEN” button will allow you to BROWSE for an existing project view file or select a recently-opened project view file. Once selected and opened, the project view is available for editing.
A Note
The "OnePager Express Start" form has a "Help" button in the upper right corner. Clicking this button provides you with access to the following form:
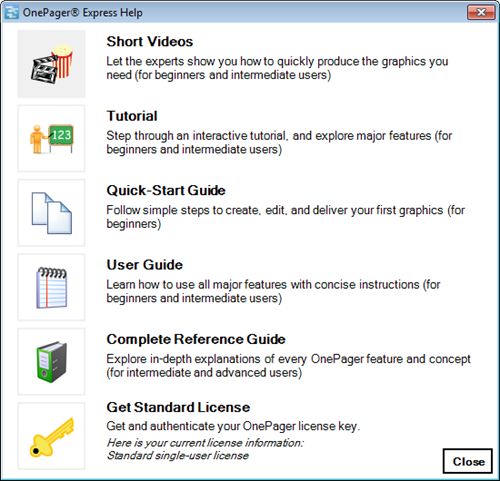
The buttons on this form provide you with access to Help information such as videos, tutorials, OnePager Documentation, and access to the standard licensing system.
Making a NEW Project View
Clicking the “NEW” button brings up the “OnePager choices” form as shown below:
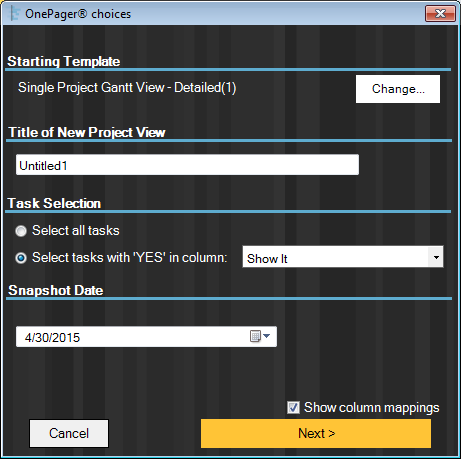
This “OnePager choices” form asks you to confirm a few things before you build the project view. It will make good guesses for each of these choices, but you can change any of them:
- a) Starting Template: The current template determines which columns get imported from Microsoft Excel and how the initial project view looks. OnePager ships with many sample templates, but you can also customize your own templates. To choose which template to use in building your project view, click the “Change…” button in the top group of the “OnePager choices” form. For now, just stick with the default template entitled “Single Project Gantt View – Detailed,” but you can always use a different template to get a different type of project view.
- b) Title of the New Project View: This is the title of the graph and also the suggested name of the file in which it will be saved, though you can change the file name when you actually save it. We recommend that you enter a title that helps you identify the view later on. For each project view that you create, OnePager remembers colors, titles, legends, font sizes, and all other graph properties so that your work is saved for future use. Later, you can update the project view with a snapshot of how the project looks on a different date. Then you can browse through the snapshots to see how the project is changing over time.
- c) Task Selection: This is how you tell OnePager Express which tasks from your Microsoft Excel plan to include. Either click the “Select all tasks” radio button to graph everything or choose a flag column. You can make several project views from a single Microsoft Excel plan, each using a different flag or number column.
- d) Snapshot Date: This is the date of the report and lets you keep track of how schedules change over time. Each project view can have several snapshots.
Changing the Microsoft Excel Column Mapping
Since the “Show column mappings” button near the bottom of the screen is checked, you will now have a chance to review and change the Microsoft Excel plan column mappings before you make your first project view. To do this, click the “Next>” button. You will now see the following screen:
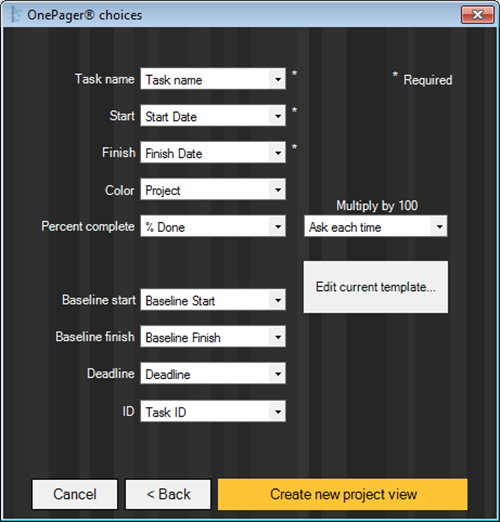
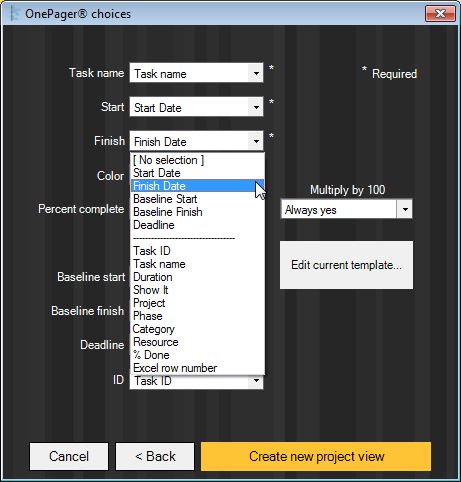
Notice in the graphic above that OnePager has relied on the current template to make some guesses on what Microsoft Excel plan columns should be used in making the graph. You can easily change any of these column mappings by making selections from the drop-down lists. For example, we show below how to change the Finish Date for tasks:
Step 3: Create a NEW Project View
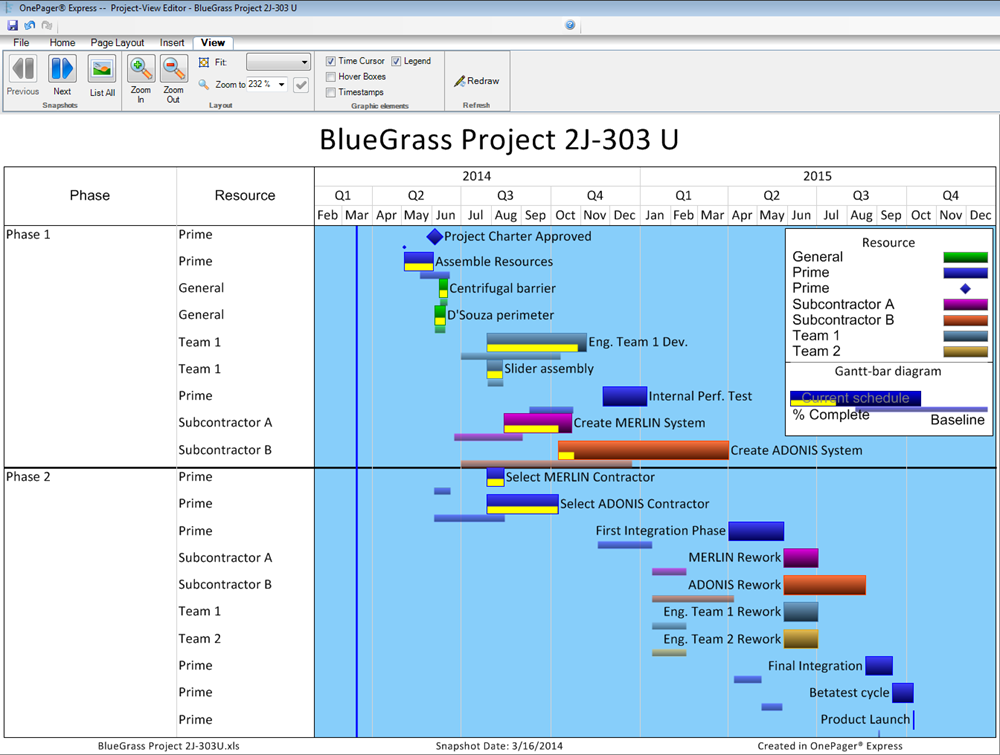
Once you are satisfied with the column mappings, click on “Create new project view” to import your selected data into OnePager and create a graph (project view) from it. After a very few moments you will see a screen that looks like this:
A Note
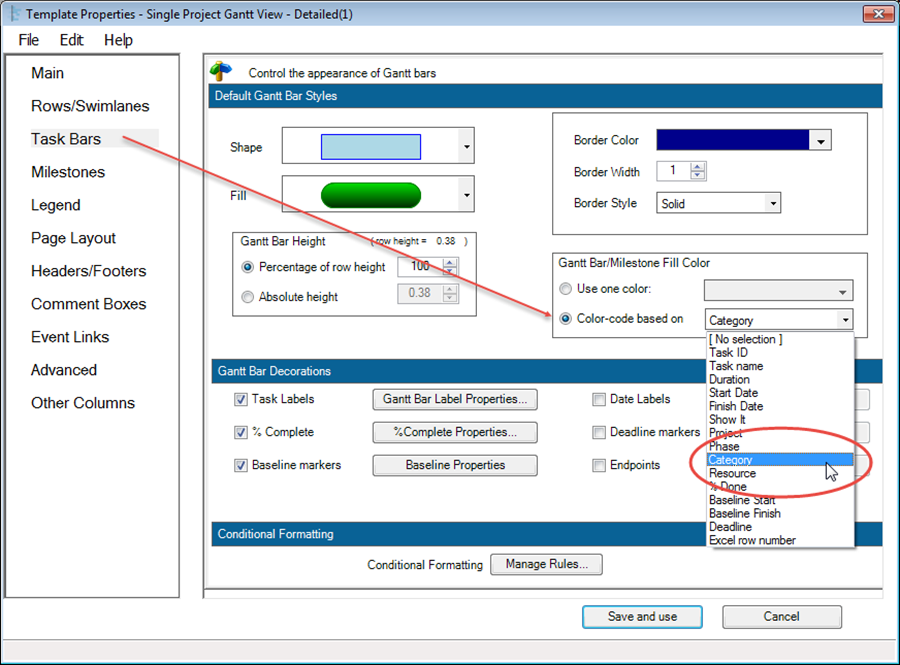
Note that each task or milestone was color-coded based on the value in the “Category” column, as is detailed in the legend. The legend contains an optional diagram near the bottom, explaining that the bars inside the Gantt bars represent percent complete extracted from Microsoft Excel. Percent complete comes from a Microsoft Excel plan column that you specified in the column mapping screen. Also note that the template that is active when you press the “Create new project view” button is the template for how things look in the new project view. The template’s “Task Bars” tab showing where the color control is located is shown below:
Step 4: OPEN an Existing Project View
Once you see the OnePager graphics, you often want to change their Microsoft Excel plan data since the graph can show project schedule problems that were not obvious before. To do this, save the project view, make the changes to your Microsoft Excel plan and re-launch OnePager. When the “OnePager Express Start” form appears, click the “OPEN” button which offers you the option to BROWSE or select a recently opened project view as shown here:
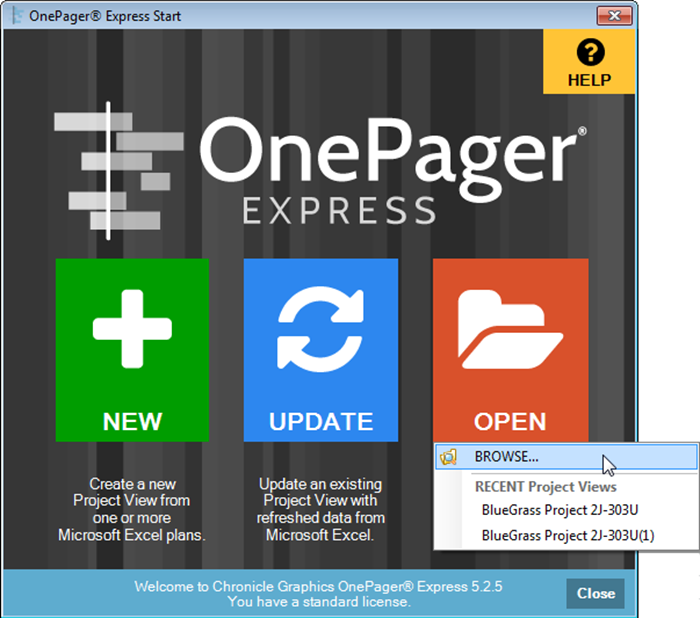
- a) Clicking any of the “RECENT Project Views” will display that project view on the screen.
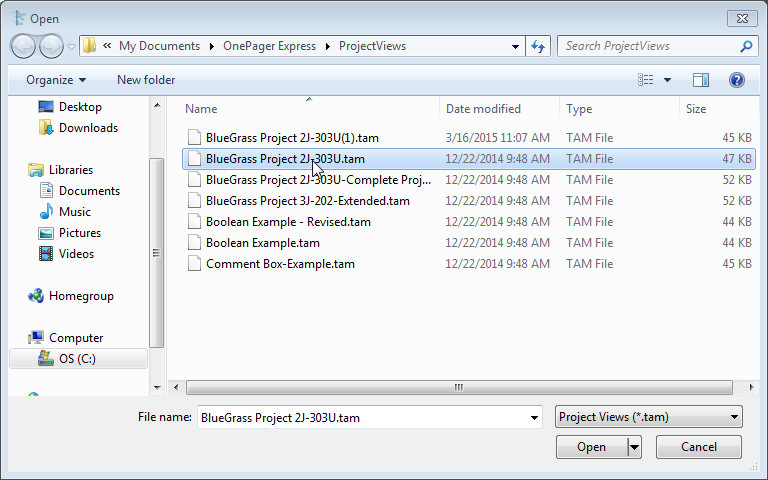
- b) Clicking the “BROWSE…” selection will bring up the Windows “Open” form as shown here:
Step 5: UPDATE a Project View
However, if you want to update your snapshot, click on the “UPDATE” button and the “OnePager choices” form for updating a project view will appear as shown below:
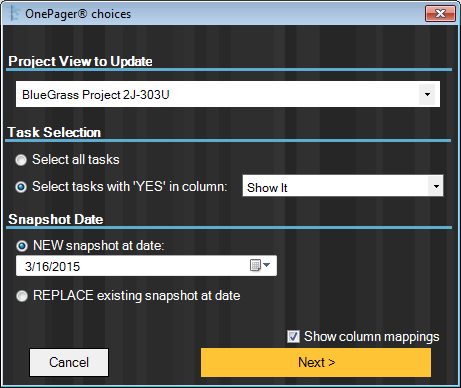
Notice that the “Project View to Update” group has the project view file name displayed in the window. The “Snapshot Date” group gives you two choices:
- a) NEW: This lets you create a new snapshot, showing how the project view looks on a different date. Progress data are imported from Microsoft Excel under this choice. Under this choice, the snapshot may include tasks/milestones that were NOT in previous snapshots if you have changed some of the selections in your flag field.
- b) REPLACE: This lets you replace tasks or add tasks that you did not previously have in the snapshot. When you click on this radio button, you see an expanded set of choices as shown above.
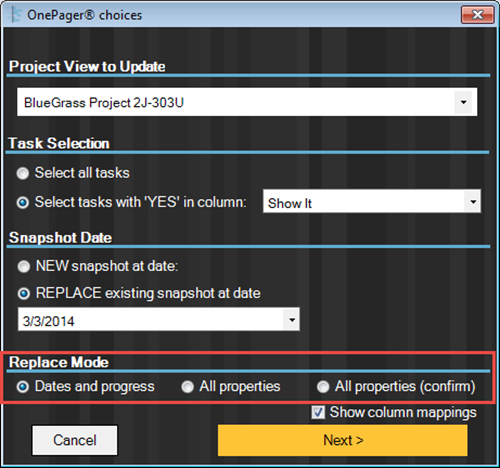
Next, select the “Dates and progress” button in the “Replacement mode” section. Click “Next>,” go past the “OnePager choices” form column mapping form and OnePager will update the snapshot to with the new data from the modified Microsoft Excel.
In the rare case when you want to update the task names from new values in the Excel file, choose “All properties” or “All properties (confirm). The latter lets you confirm each task name that is being changed.
The power of OnePager Express is illustrated best when, after a period of progress on the project, it is time to produce another project view, with the same look and feel, for a new status date. Assuming that the Microsoft Excel plan was updated with actual start and finish, percent complete, and other relevant data during the reporting interval, OnePager can easily generate a new snapshot. Simply retrieve the project view as shown in the above example and select the “UPDATE” radio button. Doing so will bring up the following “OnePager choices” form:

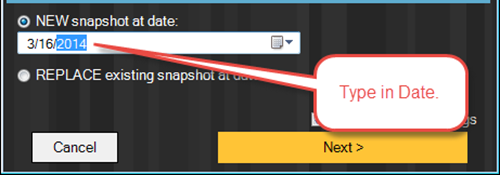
- a) Select the “NEW snapshot at date” as shown above. You will want to select a current date for the snapshot so that this snapshot will represent the project at the status date point in time. To see which snapshot dates already exist, just move the mouse cursor over the “NEW snapshot-date” box to see a list of the existing dates. Use the built in calendar drop down button or type in the new month, day, and year in the window provided as shown below:
- b) Uncheck the “Show column mappings” box if you want to use the same mappings as you used before. The bottom of the screen now looks like this:
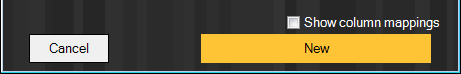
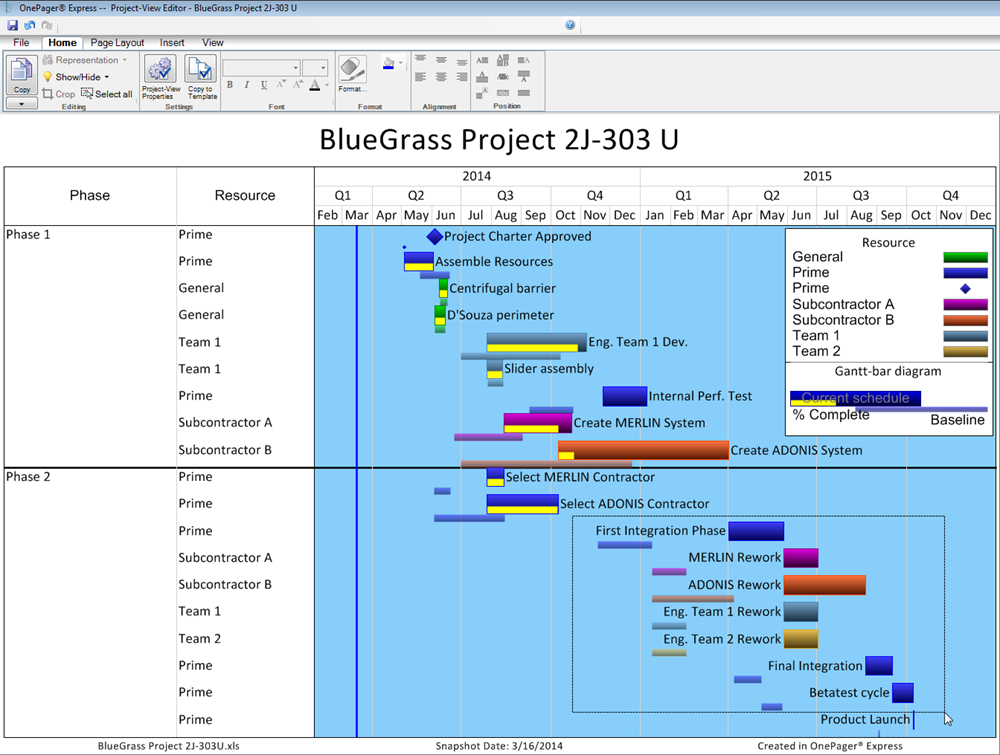
- c) Clicking the large “New” button creates a new snapshot for the project view, showing how the project changed from the previous snapshot date to the date entered for the current snapshot. The project view opens at the new snapshot. The color, fonts, title, and swimlane assignments are consistent between the two snapshots:

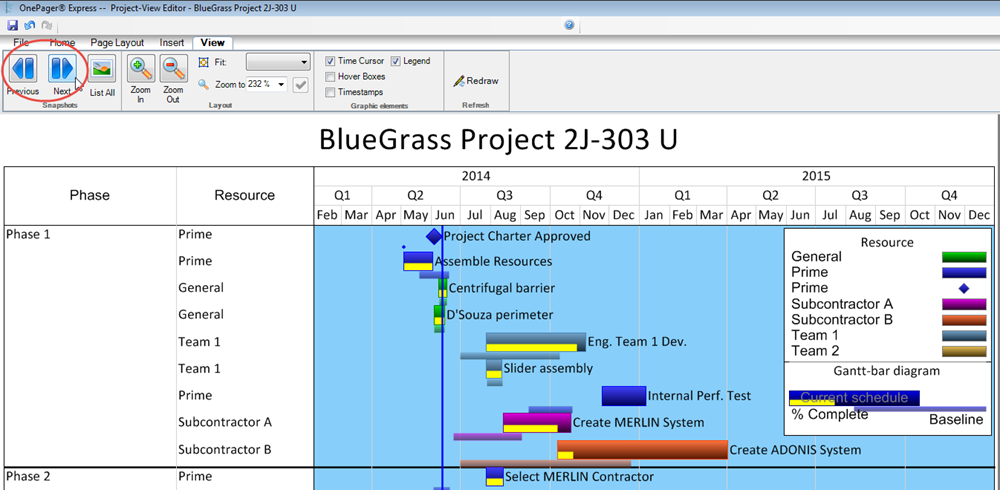
- d) You can go back and forth between the two snapshots by using the snapshot forward/backward buttons on the “View” ribbon as shown above:
Step 6: Edit Your Project View
Sooner or later, most of you will edit the font sizes and text position to optimize readability. To do this, hold down the left mouse button and “drag” a selection box that encloses many tasks/milestones at once:
- a) When you release the mouse, the enclosed tasks/milestones will all be selected:

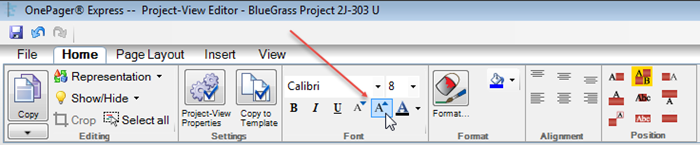
- b) Click on the “Increase Font Size” button on the tool bar shown below:
- c) The project view will now look something like this:
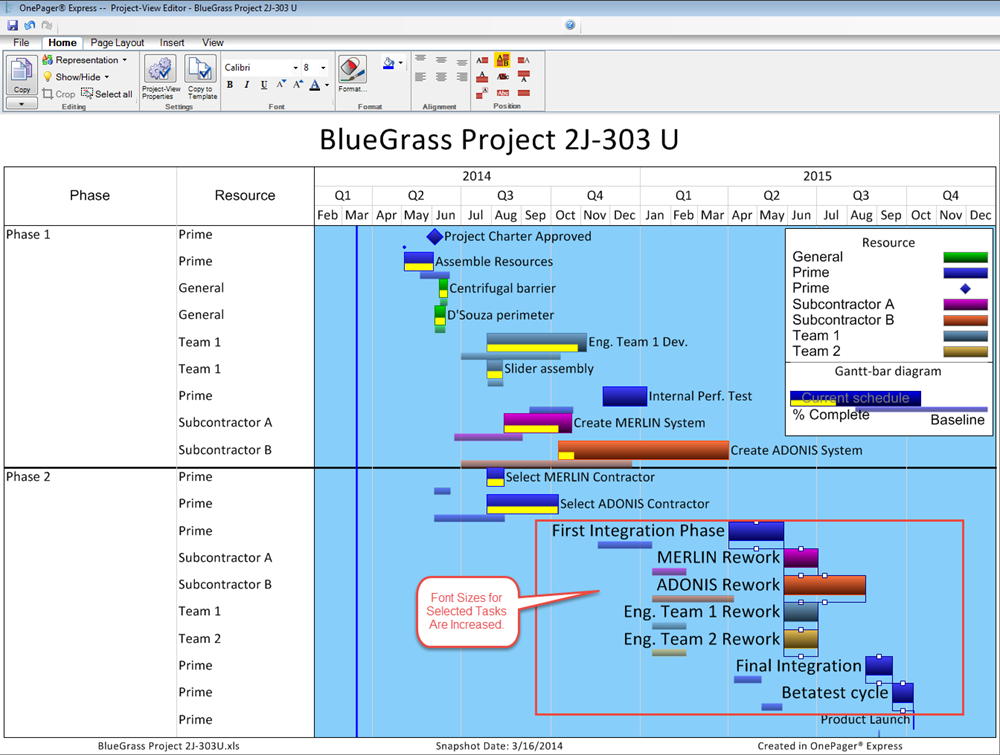
- d) Repeating this operation for the remaining tasks/milestones (we could have done “Select All” and done it all at once!), we obtain a project view with larger fonts on all the tasks/milestones:
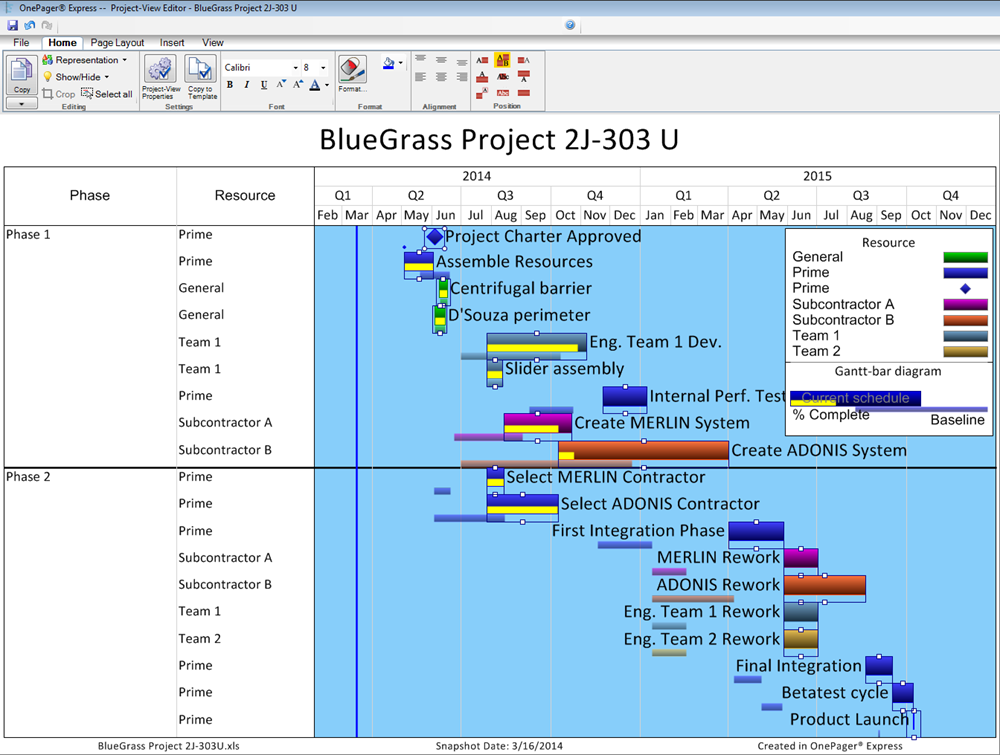
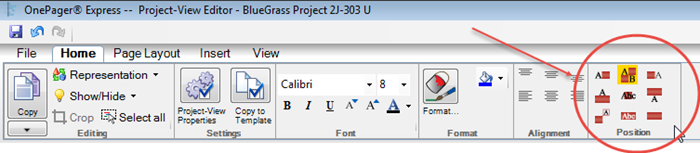
Another common editing task is to move the task names from their current position, centered on the task, to a position left or right of the task. To do this, select a set of shapes as before, but this time click on one of the text-positioning buttons on the tool bar:
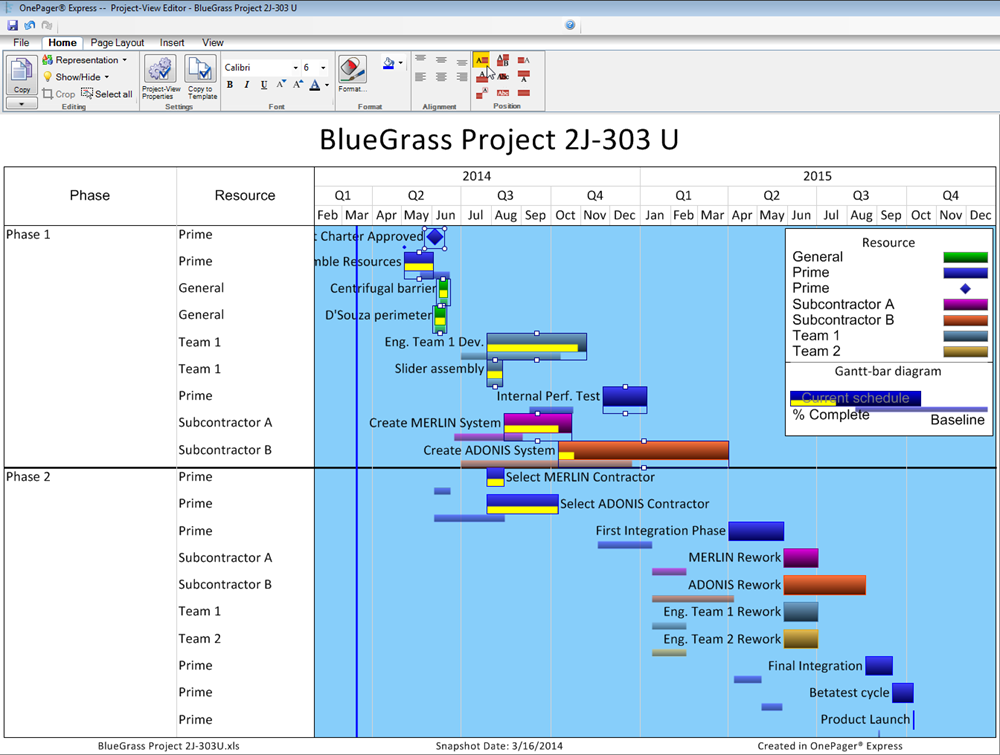
- a) Doing this on several batches of tasks/milestones results in the following edited project view. (We have also dragged the legend to a new position and have adjusted some of its font sizes):
- b) In case you change your mind about the last editing action you took, you can UNDO the last editing action by clicking the UNDO button above the OnePager tool bar. Successive clicking the UNDO button will undo editing actions in the reverse order that they were applied.
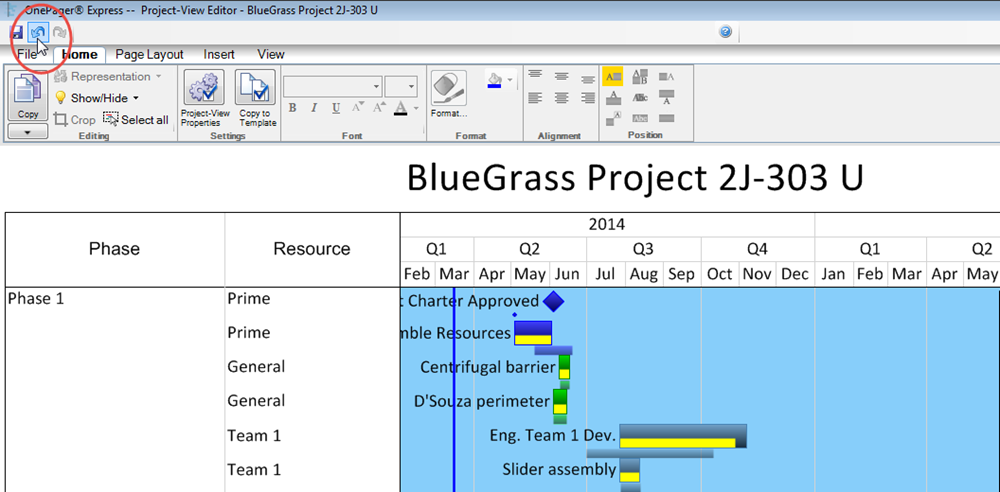
Save the edited project view by clicking the save button above the tool bar next to the UNDO button. All of the font-size changes, text-position edits, and the new legend position are now saved in the file structure in case you need to update this project view with new data at a later time.
Finally copy the current snapshot of the project view to the clipboard by clicking the “Copy” button on the tool bar. Then paste the graph into a PowerPoint slide, as shown below:
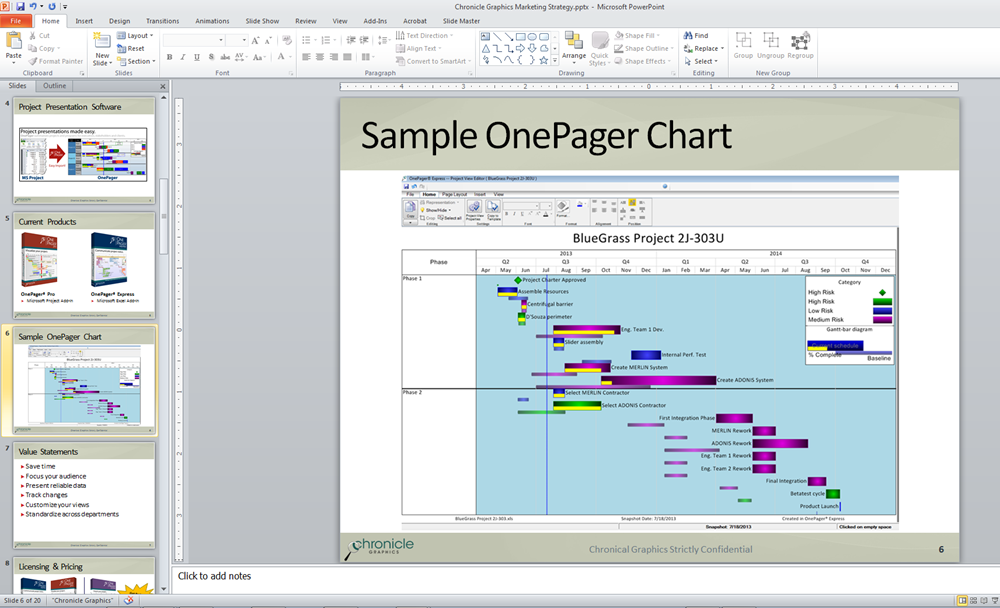
That’s it! You have now created a professional 1-page schedule summary from a complex Microsoft Excel plan schedule and have copied it into a PowerPoint presentation. You can also print the graph by selecting File…Print. OnePager has other features that let you move tasks vertically to different “rows and swimlanes,” change the number of swimlanes, add swimlane titles, show dependencies among tasks, change task colors, hide tasks, add floating comment boxes, and standardize on graph styles across organizations. To learn more about these features, read about the specific workflows in the OnePager Express User Guide.
(3.2)