Making Multi-Project Graphs from Separate Microsoft Excel Plans
Suppose you have multiple Microsoft Excel Plans that are related and you want to create a single project view that will show the important schedule items. You can do this as long as the related Microsoft Excel plans are constructed with unique Task ID column contents. This is necessary because unlike Microsoft Project, Microsoft Excel does not automatically provide a unique identifier for rows. Additionally, unique Task ID numbers are needed so that OnePager Express does not get rows confused when performing snapshot updates.
Preparation for Making a Multi-Project Graph from Separate Microsoft Excel Plans
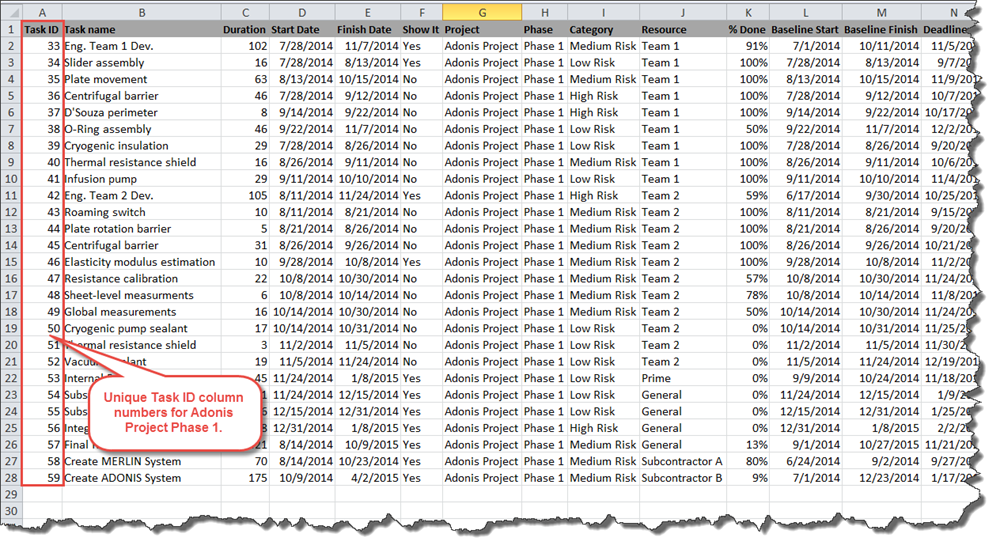
To illustrate what is needed let’s construct a multi-project project view from the BlueGrass 2J-303U Microsoft Excel file by splitting this file into three distinct files as shown below:
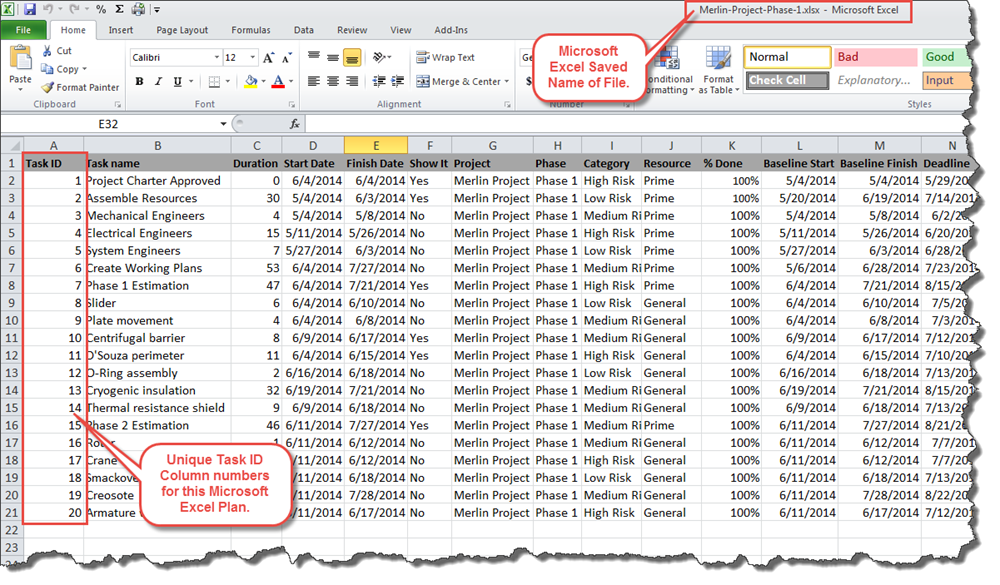
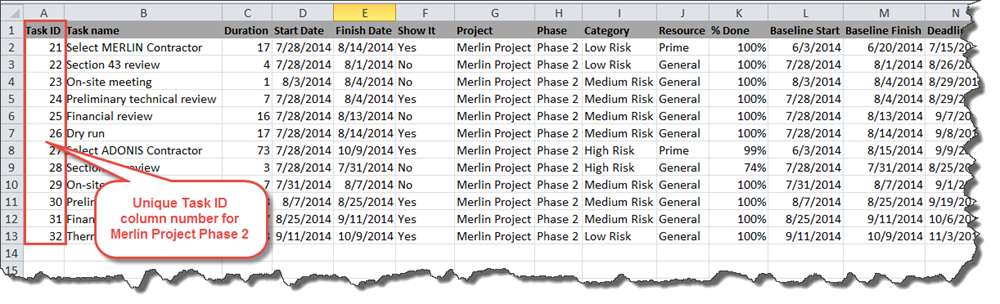
Each of the Microsoft Excel plans above have unique “Task ID” columns with unique numbers in each. It is important that throughout the use of these Microsoft Excel plans that these assigned unique Task ID numbers remain with their respective tasks. Dates may change in the rows along with other updated information as the projects progress but the Task ID number must remain associated with the task activity. Tasks may be deleted if required but the deleted Task ID should not be reused for a later snapshot. OnePager Express can process out of sequence Task ID numbers.
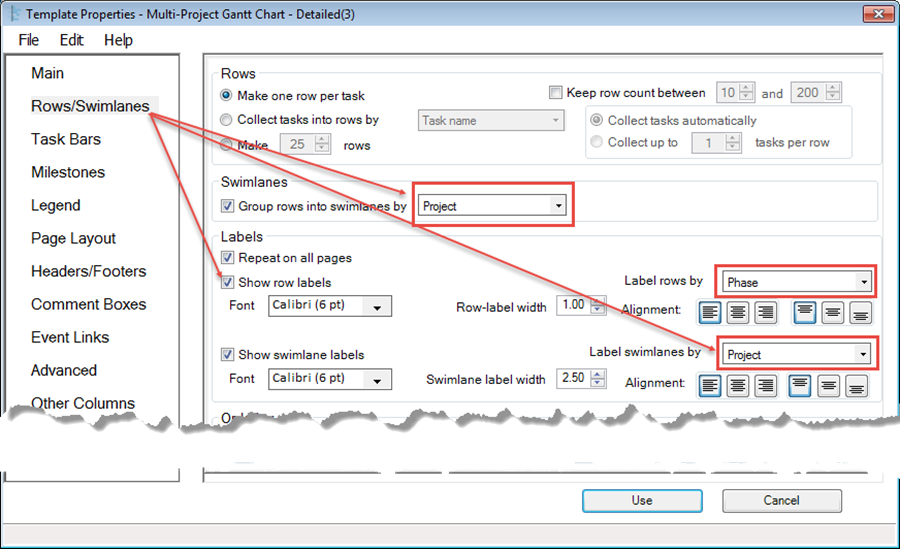
The next step is to select and update an appropriate OnePager Express template. For this illustration we’ve selected the “Multi-Project Gantt Chart – Detailed” Template. The following steps are necessary to prepare the template:
- a) Go to the “Rows/Swimlanes” tab and make sure that the “Group rows into swimlanes” and “Label swimlanes by” windows are set to “Project”. Also, for this illustration, make sure that row labels will be displayed and that the “Label rows by” window is set to “Phase”. The “Rows/Swimlanes” tab will look like this:
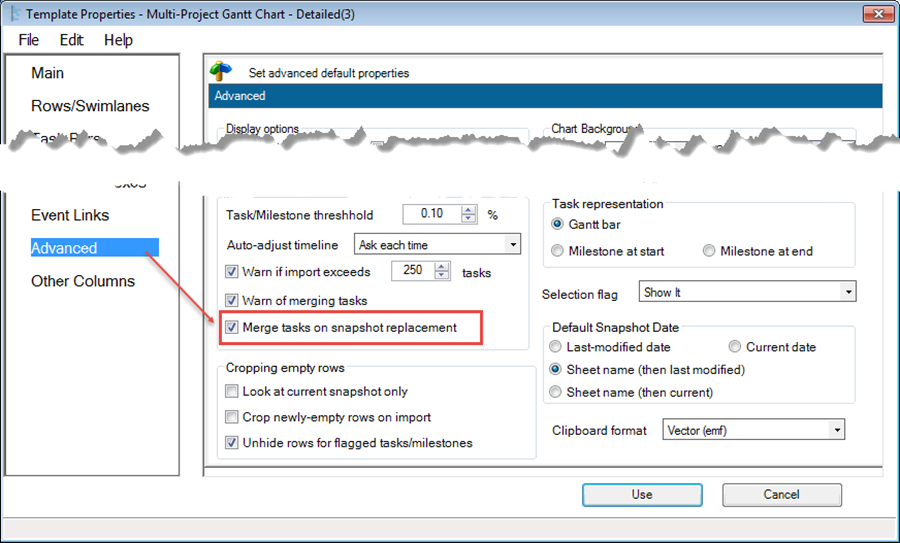
- b) Next, go to the “Advanced” tab and check the box titled “Merge tasks on snapshot replacement”. Checking this box in the template puts any project views created with this template into the “Multi-File Multi-Project Mode”. This mode is specifically designed to support users who want to create multi-project project views from several independent Microsoft Excel plans.. The “Advanced” tab of the template will look like this when you are finished:
- c) When the steps above are completed and the template updated click the “Save and use” button to make the modified template the current template.
Creating and Updating a Multi-Project Graph from Multiple Microsoft Excel Plans
With the preparation of the template completed, you are ready to create the first multi-project graph. Launch Microsoft Excel and open the first of the multi-project Microsoft Excel plans. In this case it’s the “Merlin Project Phase 1” file. Then, launch OnePager in the “NEW” mode, being sure to provide the project name and other required entries in the “OnePager choices” form. When you click the “Create new project view” button, the first project view as shown below:
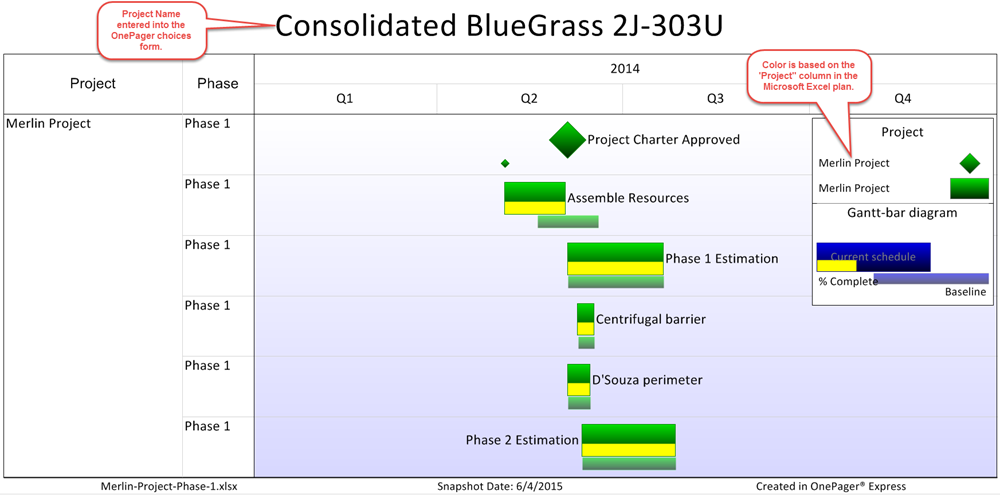
All tasks are grouped into one large swimlane labeled “Merlin Project”. The title is taken from the “OnePager choices” form when entered to create the first graph.
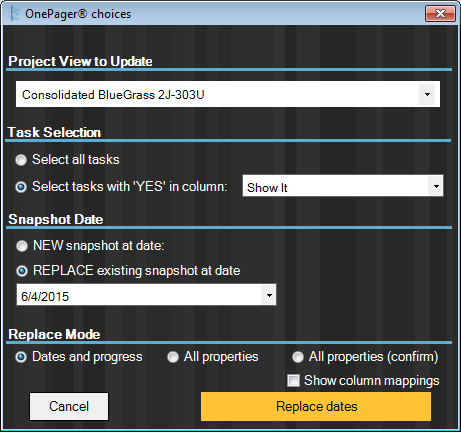
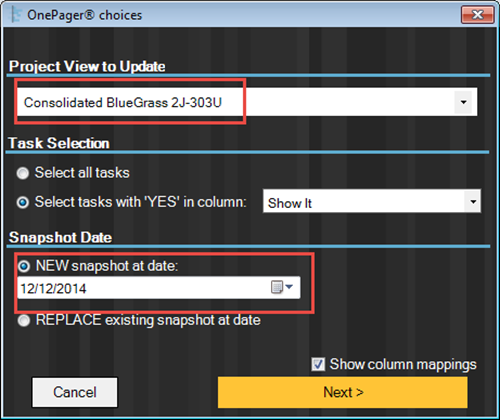
We now open the second Microsoft Excel plan call “Merlin Project Phase 2”, launch OnePager Express and select “UPDATE” from the selections on the “OnePager Express Start” form. When the “OnePager choices” form appears, select the “REPLACE existing snapshot at date” radio button and make sure the date is the same as the snapshot date above, 6/4/2014, in this case as shown below:
When the “Replace dates” button is clicked, the updated project view will look like this:
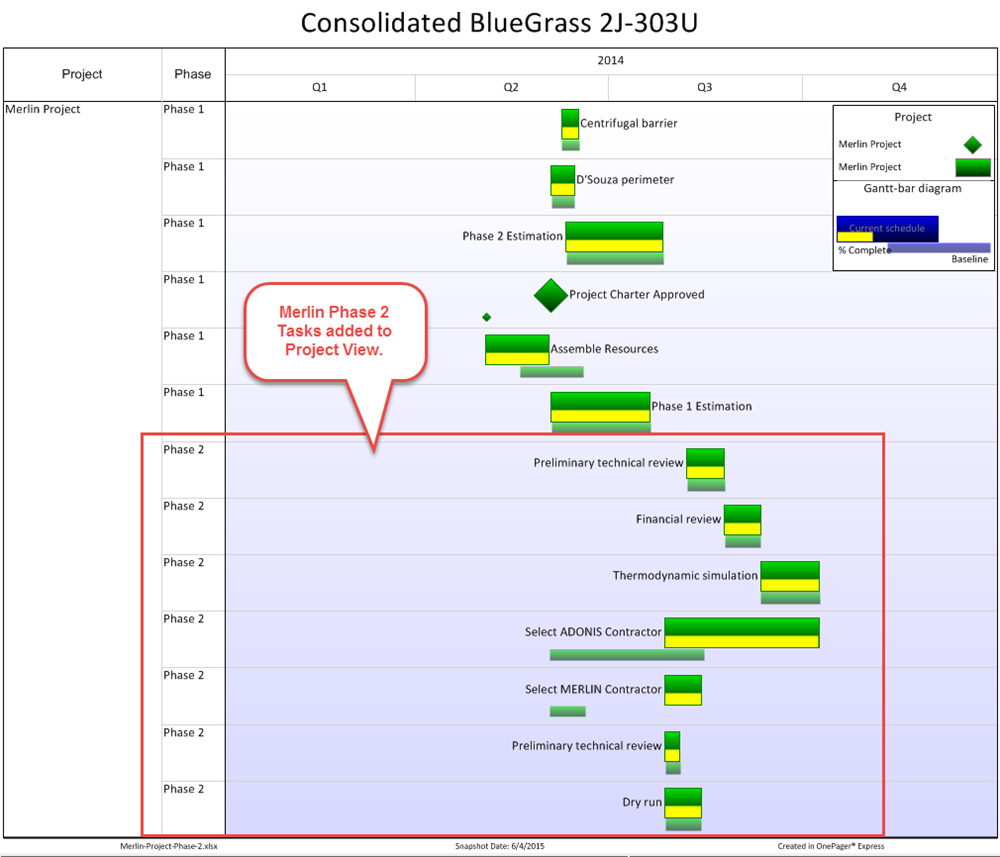
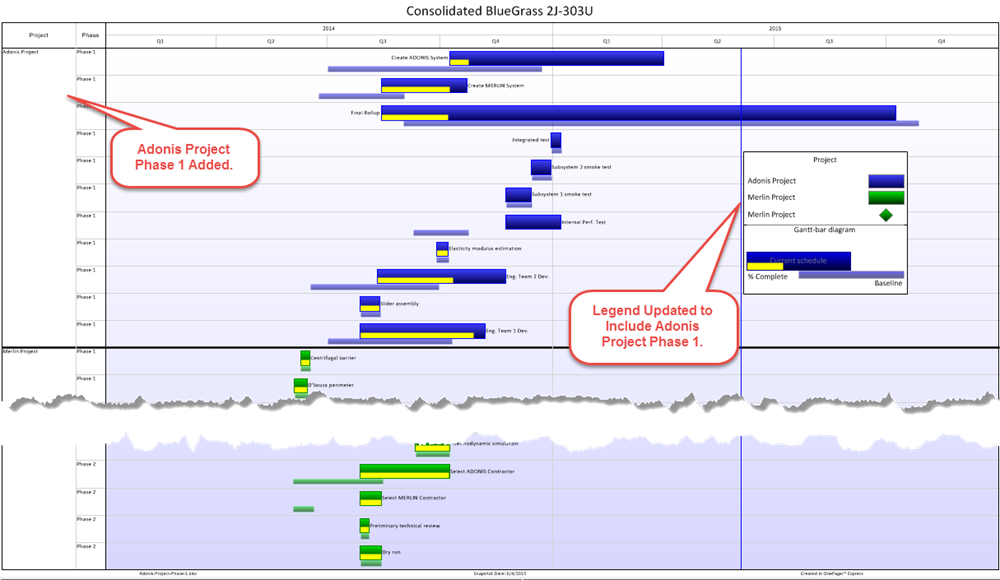
The result of the update action is to update the project view to include the Merlin Phase 2 tasks. Above we took the liberty to sort the rows within the “Merlin Project” swimlane by “Phase”.
All that remains is to repeat the above process one more time to incorporate the “Adonis Phase 1” tasks. When this is accomplished the finished first snapshot of the project view will look like this:
Once you merge all your projects into a single snapshot, you can now add a new snapshot to the project view to show how tasks changed as the projects progresses. Be aware that you will need to insert the individual projects into the new snapshot one file at a time. That means you will need to choose UPDATE from the “OnePager Express Start” form and NEW from the “OnePager choices” form for the first file of the new snapshot. The “OnePager choices” form for this “UPDATE” and “NEW” action is shown below:
For updating the remaining Microsoft Excel plans in the multi-project snapshot you will need to choose “UPDATE” and “REPLACE” for all remaining Microsoft Excel plans of the new snapshot.
(8.4)