Difference between revisions of "Modifying the Time Axis for Version 5.3 (Portal)"
From OnePager Documentation
(→About Modifying the Time Axis) |
m (Text replacement - ".png]]" to ".png|link=]]") |
||
| Line 3: | Line 3: | ||
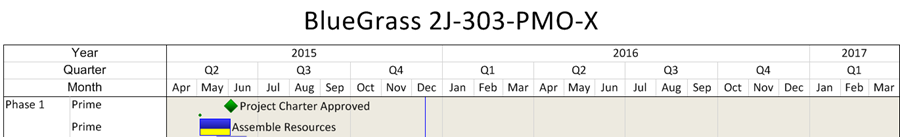
The '''time axis''' is an integral part of the project view. It can be displayed at the '''top and/or the bottom''' of the graph. It can be displayed in many formats to suit your needs and can be displayed in multiple levels as shown below: | The '''time axis''' is an integral part of the project view. It can be displayed at the '''top and/or the bottom''' of the graph. It can be displayed in many formats to suit your needs and can be displayed in multiple levels as shown below: | ||
| − | <center>[[File:P53-22_0_1-53-(1)-01042015.png]]</center> | + | <center>[[File:P53-22_0_1-53-(1)-01042015.png|link=]]</center> |
Use the following links to learn more about the OnePager time axis: | Use the following links to learn more about the OnePager time axis: | ||
Latest revision as of 12:07, 22 June 2025
About Modifying the Time Axis
The time axis is an integral part of the project view. It can be displayed at the top and/or the bottom of the graph. It can be displayed in many formats to suit your needs and can be displayed in multiple levels as shown below:
Use the following links to learn more about the OnePager time axis:
(22.0.1-53)