Difference between revisions of "Main Tab for Version 7.0"
(→Task Selection Control Group) |
|||
| Line 3: | Line 3: | ||
1) The '''Chart Properties''' '''Main''' tab page, shown below, lets you set the most general '''properties''' of a chart. | 1) The '''Chart Properties''' '''Main''' tab page, shown below, lets you set the most general '''properties''' of a chart. | ||
| − | <center>[[File:P70-21_1_1-70-(1)- | + | <center>[[File:P70-21_1_1-70-(1-1)-10132020.png]]</center> |
| − | <center> | + | <center><P70-21_1_1-70-(1-1)-10132020.png></center> |
2) Each of these '''properties''' is discussed below organized by control group. | 2) Each of these '''properties''' is discussed below organized by control group. | ||
| Line 16: | Line 16: | ||
4) The information for the '''Title''' is taken from the '''OnePager choices''' form's '''Title of New Chart''' type in window as shown below: | 4) The information for the '''Title''' is taken from the '''OnePager choices''' form's '''Title of New Chart''' type in window as shown below: | ||
| − | <center>[[File:P70-21_1_1-70-(2)- | + | <center>[[File:P70-21_1_1-70-(2)-10132020.png]]</center> |
| − | <center> | + | <center><P70-21_1_1-70-(2)-10132020.png></center> |
5) For more information on the '''OnePager choices''' form, please see the article at: [[Getting Started with Version 7.0 (Portal) | Getting Started (Portal)]]. 3.0.1-70 | 5) For more information on the '''OnePager choices''' form, please see the article at: [[Getting Started with Version 7.0 (Portal) | Getting Started (Portal)]]. 3.0.1-70 | ||
| Line 35: | Line 35: | ||
10) The controls are shown below: | 10) The controls are shown below: | ||
| − | <center>[[File:P70-21_1_1-70-(3)- | + | <center>[[File:P70-21_1_1-70-(3)-10132020.png]]</center> |
| − | <center> | + | <center><P70-21_1_1-70-(3)-10132020.png></center> |
11) The '''lower left corner''' of the chart becomes available when you specify that the '''Time Axis''' is to be displayed on the '''bottom''' of the chart. | 11) The '''lower left corner''' of the chart becomes available when you specify that the '''Time Axis''' is to be displayed on the '''bottom''' of the chart. | ||
| − | 13) These '''corners''' can be used to show the '''row/swimlane''' headings (e.g., '''text columns''' and '''swimlane labels'''), the '''time axis''' unit '''labels''', or neither. | + | 13) These '''corners''' can be used to show the '''row/swimlane''' headings (e.g., '''text columns''' and '''swimlane level labels'''), the '''time axis''' unit '''labels''', or neither. |
14) For more information, please see these two articles: [[Labeling the Corner for OnePager Pro for Version 7.0 | Labeling the Corner for OnePager Pro]] 22.2.3-70 and [[Labeling the Corner for OnePager Express for Version 7.0 | Labeling the Corner for OnePager Express]]. 22.2.4-70 | 14) For more information, please see these two articles: [[Labeling the Corner for OnePager Pro for Version 7.0 | Labeling the Corner for OnePager Pro]] 22.2.3-70 and [[Labeling the Corner for OnePager Express for Version 7.0 | Labeling the Corner for OnePager Express]]. 22.2.4-70 | ||
| Line 54: | Line 54: | ||
:c) For establishing the '''properties''' of the chart's '''Borders, frames, and the time-cursor'''. | :c) For establishing the '''properties''' of the chart's '''Borders, frames, and the time-cursor'''. | ||
| − | ====Palettes==== | + | ====Color Palettes==== |
16) In the '''Palettes''' sub-control group, the '''Default palette:''' control allows you to set the default '''color''' from a dropdown list as shown below. | 16) In the '''Palettes''' sub-control group, the '''Default palette:''' control allows you to set the default '''color''' from a dropdown list as shown below. | ||
| − | <center>[[File:P70-21_1_1-70-(4)- | + | <center>[[File:P70-21_1_1-70-(4)-10132020.png]]</center> |
| − | <center> | + | <center><P70-21_1_1-70-(4)-10132020.png></center> |
17) OnePager provides a wide variety of '''color palettes'''. | 17) OnePager provides a wide variety of '''color palettes'''. | ||
| Line 67: | Line 67: | ||
19) Clicking the '''Edit color palettes...''' button accesses the '''Color Palette Editor''' form shown below: | 19) Clicking the '''Edit color palettes...''' button accesses the '''Color Palette Editor''' form shown below: | ||
| − | <center>[[File:P70-21_1_1-70-(5)- | + | <center>[[File:P70-21_1_1-70-(5)-10132020.png]]</center> |
| − | <center> | + | <center><P70-21_1_1-70-(5)-10132020.png></center> |
20) This '''Color Palette Editor''' form allows you to '''edit''' a particular '''color palette'''. | 20) This '''Color Palette Editor''' form allows you to '''edit''' a particular '''color palette'''. | ||
| Line 86: | Line 86: | ||
====Chart Background==== | ====Chart Background==== | ||
| − | + | =====Color 1 and Color 2===== | |
| − | <center>[[File:P70-21_1_1-70-(8)- | + | 24) This control group, shown below, allows you to manage the chart's '''background colors''' and create various '''"zebra" striping''' highlights. |
| − | <center> | + | |
| + | <center>[[File:P70-21_1_1-70-(8)-10132020.png]]</center> | ||
| + | <center><P70-21_1_1-70-(8)-10132020.png></center> | ||
25) To show a '''phasing or transition''' of '''color''' across the '''background''', choose two colors to '''blend''' and choose the '''blending direction'''. | 25) To show a '''phasing or transition''' of '''color''' across the '''background''', choose two colors to '''blend''' and choose the '''blending direction'''. | ||
| Line 95: | Line 97: | ||
26) Alternatively, you can choose to have a '''single-color background''' by setting '''Color 1''' and '''Color 2''' to the same '''color''' selection. | 26) Alternatively, you can choose to have a '''single-color background''' by setting '''Color 1''' and '''Color 2''' to the same '''color''' selection. | ||
| − | 27) Additionally, this group allows '''Zebra-striping''' of '''rows and | + | 27) Additionally, this group allows '''Zebra-striping''' of '''rows and swimlane levels'''. |
28) For more information on '''Zebra-striping''', please see the articles at: | 28) For more information on '''Zebra-striping''', please see the articles at: | ||
| Line 105: | Line 107: | ||
|} | |} | ||
</center> | </center> | ||
| + | |||
| + | =====Chart Fill Pattern===== | ||
| + | |||
| + | 29) The '''Color fill pattern''' dropdown list provides the means for using '''Color 1''' and/or '''Color 2''' to create the desired '''flow of color''' within the '''graph area'''. | ||
| + | |||
| + | :a) There are up to nine (9) '''Color fill pattern''' options to select form as shown below: | ||
| + | |||
| + | <center>[[File:P70-21_1_1-70-(8A)-10132020.png]]</center> | ||
| + | <center><P70-21_1_1-70-(8A)-10132020.png></center> | ||
| + | |||
| + | :b) The first five (5) options in the '''Color fill pattern''' list provide the means to use '''Color 1 and Color 2''' in various ways across the '''graph area'''. | ||
| + | |||
| + | :c) The '''Row striping''' option uses '''Color 1 and Color 2''' alternately from the bottom of the chart to the top to create '''row zebra striping''' as discussed above. | ||
| + | |||
| + | :d) The three '''swimlane stripes''' options for the '''Left#1''', '''Left#2''', and '''Left#3''' '''swimlane levels''' also use '''Color 1 and Color 2''' alternately from the bottom of the chart to the top to create '''swimlane level zebra striping''' as described above. | ||
| + | |||
| + | :e) For more information on '''Multiple Swimlane Levels''', please see the articles at: [[Creating and Editing Rows and Swimlanes for Version 7.0 (Portal) | Creating and Editing Rows and Swimlanes (Portal)]] 12.0.1-70. | ||
====Borders, Frame, and Time-cursor Properties==== | ====Borders, Frame, and Time-cursor Properties==== | ||
| + | |||
| + | =====Set Line Properties Form===== | ||
29) Clicking this button accesses the '''Set line properties''' form that lets you customize the '''border properties''' of various lines for: | 29) Clicking this button accesses the '''Set line properties''' form that lets you customize the '''border properties''' of various lines for: | ||
| − | :a) ''' | + | :a) '''The Time Cursor''' and |
| − | :b) The '''Inner and Outer''' Frames (the rectangles that surround the '''graph''') | + | :b) The '''Inner and Outer''' Frames (the rectangles that surround the '''graph'''). |
| − | + | 30) The form has three (3) tabs as shown below: | |
| − | + | <center>[[File:P70-21_1_1-70-(9)-10132020.png]]</center> | |
| + | <center><P70-21_1_1-70-(9)-10132020.png></center> | ||
| − | + | 31) For managing the '''Swimlane Borders''' and '''Row Borders''' for '''Line color''', '''Line width''', '''Dash type''', and '''Border type''' the controls are found on the '''Rows/Swimlanes''' tab. | |
| − | + | ||
| − | + | 32) All these '''border''' controls operate like similarly named controls found elsewhere in OnePager. | |
| − | + | ||
| − | + | ||
33) The '''Time cursor''', '''Inner Frame''', and '''Outer Frame''' tabs have just the '''Line color''', '''Line width''', '''Dash type''' controls. | 33) The '''Time cursor''', '''Inner Frame''', and '''Outer Frame''' tabs have just the '''Line color''', '''Line width''', '''Dash type''' controls. | ||
| Line 129: | Line 148: | ||
34) The '''Set line properties''' form only '''sets the properties''' of these specific '''graphic elements'''. | 34) The '''Set line properties''' form only '''sets the properties''' of these specific '''graphic elements'''. | ||
| − | 35) Although the '''Outer''' and '''Inner Frames''' are displayed, it is necessary to | + | 35) Although the '''Outer''' and '''Inner Frames''' are displayed, it is necessary to manually turn '''ON''' the specific controls for '''Swimlane Borders''' and '''Row Borders''' as well as turn '''ON''' the '''Time Cursor'''. |
| − | 36) To turn ''' | + | 36) To turn '''ON''' the '''Row Borders''' and '''Swimlane Borders''', you need to go to the '''Chart Properties''' form '''Rows/Swimlanes''' tab where these '''ON''' and '''OFF''' controls reside. |
| − | 37) | + | 37) For more information on the '''Rows/Swimlanes''' tab, please see the article at: [[Rows/Swimlane Tab for Version 7.0 | Rows/Swimlane Tab]]. 21.2.1-70 |
| − | 38) To turn ''' | + | 38) To turn '''ON''' the '''Time cursor''', the controlling checkbox is located on the OnePager '''View''' ribbon tool bar tab in the '''Graphic elements''' group. |
| − | 39) The '''Time cursor''' can also be turned ''' | + | 39) The '''Time cursor''' can also be turned '''ON''' by checking the '''Show time cursor''' checkbox in the '''Template Properties''' and '''Chart Properties''' form's '''Advanced''' tab. |
40) For more information on the '''Advanced''' tab, please see the articles at: | 40) For more information on the '''Advanced''' tab, please see the articles at: | ||
| Line 147: | Line 166: | ||
|} | |} | ||
</center> | </center> | ||
| + | |||
| + | =====Swimlane Levels and Row Text Columns===== | ||
41) For clarity, these '''graphic elements''' are shown in the illustration below: | 41) For clarity, these '''graphic elements''' are shown in the illustration below: | ||
| − | <center>[[File: | + | <center>[[File:P70-0_4_1-(7)-06112020.png]]</center> |
| − | <center> | + | <center>P70-0_4_1-(7)-06112020.png</center> |
| + | |||
| + | :a) OnePager supports up to three (3) '''swimlane levels''' in the chart that are managed in the '''Rows/Swimlanes''' tab of the '''Template Properties''' and '''Chart Properties''' forms. | ||
| + | |||
| + | :b) OnePager also up to supports (5) '''text columns''' located to the right of any displayed '''swimlane level labels''' that are also managed in the '''Rows/Swimlanes''' tab of the '''Template Properties''' and '''Chart Properties''' forms. | ||
===Task Selection Control Group=== | ===Task Selection Control Group=== | ||
| Line 157: | Line 182: | ||
42) This control tells OnePager which field from the Microsoft Project or Excel '''source plan''' to use to control OnePager’s '''import''' of data as shown below: | 42) This control tells OnePager which field from the Microsoft Project or Excel '''source plan''' to use to control OnePager’s '''import''' of data as shown below: | ||
| − | <center>[[File:P70-21_1_1-70-( | + | <center>[[File:P70-21_1_1-70-(11)-10132020.png]]</center> |
| − | <center> | + | <center><P70-21_1_1-70-(11)-10132020.png></center> |
43) Clicking the '''Select all tasks''' radio button causes OnePager to '''import all tasks''' when an '''Update of any kind''' is performed after the chart is '''created'''. | 43) Clicking the '''Select all tasks''' radio button causes OnePager to '''import all tasks''' when an '''Update of any kind''' is performed after the chart is '''created'''. | ||
| − | 44) Clicking the '''Select task with ' | + | 44) Clicking the '''Select task with 'YES' in field:''' radio button causes OnePager to '''import tasks using the field''' named in the dropdown menu window when an '''Update of any kind''' is performed after the chart is '''created'''. |
45) Clicking the '''Select tasks by custom filter''' radio button enables the '''Edit filter...''' button that access the '''Condition Import Rules''' form as shown below: | 45) Clicking the '''Select tasks by custom filter''' radio button enables the '''Edit filter...''' button that access the '''Condition Import Rules''' form as shown below: | ||
| − | <center>[[File:P70-21_1_1-70-( | + | <center>[[File:P70-21_1_1-70-(12)-10132020.png]]</center> |
| − | <center> | + | <center><P70-21_1_1-70-(12)-10132020.png></center> |
46) For more information on '''Custom Import Filters''', please see the articles at: [[Conditional Import for Version 7.0 (Portal) | Conditional Import Filters (Portal)]]. 7.18.1-70 | 46) For more information on '''Custom Import Filters''', please see the articles at: [[Conditional Import for Version 7.0 (Portal) | Conditional Import Filters (Portal)]]. 7.18.1-70 | ||
Revision as of 20:02, 13 October 2020
Contents
About the Main Tab
1) The Chart Properties Main tab page, shown below, lets you set the most general properties of a chart.
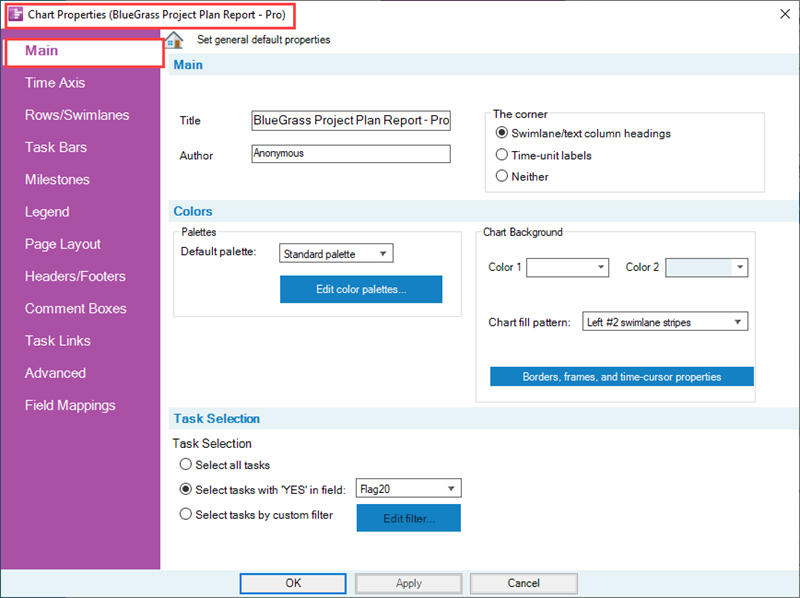
2) Each of these properties is discussed below organized by control group.
Main Control Group
Title
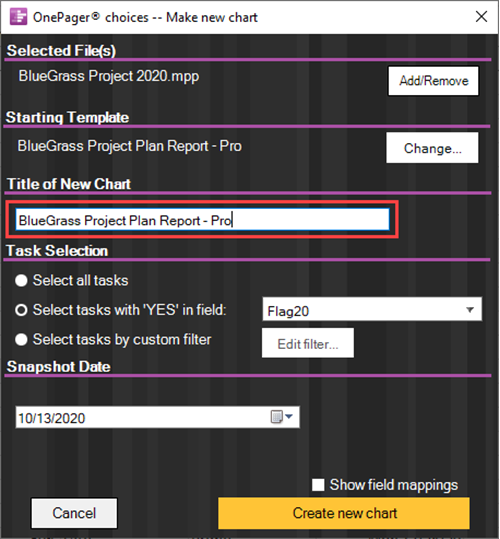
3) The Title is the name of the chart that appears above the graph area.
4) The information for the Title is taken from the OnePager choices form's Title of New Chart type in window as shown below:
5) For more information on the OnePager choices form, please see the article at: Getting Started (Portal). 3.0.1-70
Author
6) The Author window is intended to hold the name of the person that appears in a Header or Hooter entry in the chart if desired.
7) The default Author is preset to Anonymous.
8) To change the Author select the contents of the window and type in the desired Author's name.
The Corner
9) The Corner refers to the sub-control group used to designate the use of the upper left and lower left corners of the chart.
10) The controls are shown below:
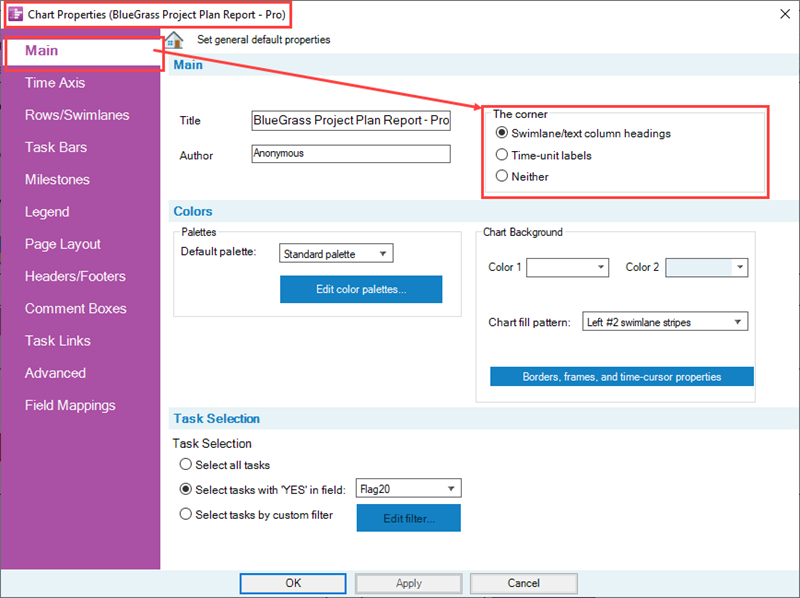
11) The lower left corner of the chart becomes available when you specify that the Time Axis is to be displayed on the bottom of the chart.
13) These corners can be used to show the row/swimlane headings (e.g., text columns and swimlane level labels), the time axis unit labels, or neither.
14) For more information, please see these two articles: Labeling the Corner for OnePager Pro 22.2.3-70 and Labeling the Corner for OnePager Express. 22.2.4-70
Colors Control Group
15) The Color control group has three sub-groups:
- a) For setting the properties relate to the use color in the chart - Palettes.
- b) For establishing the properties of the Chart Background
- c) For establishing the properties of the chart's Borders, frames, and the time-cursor.
Color Palettes
16) In the Palettes sub-control group, the Default palette: control allows you to set the default color from a dropdown list as shown below.
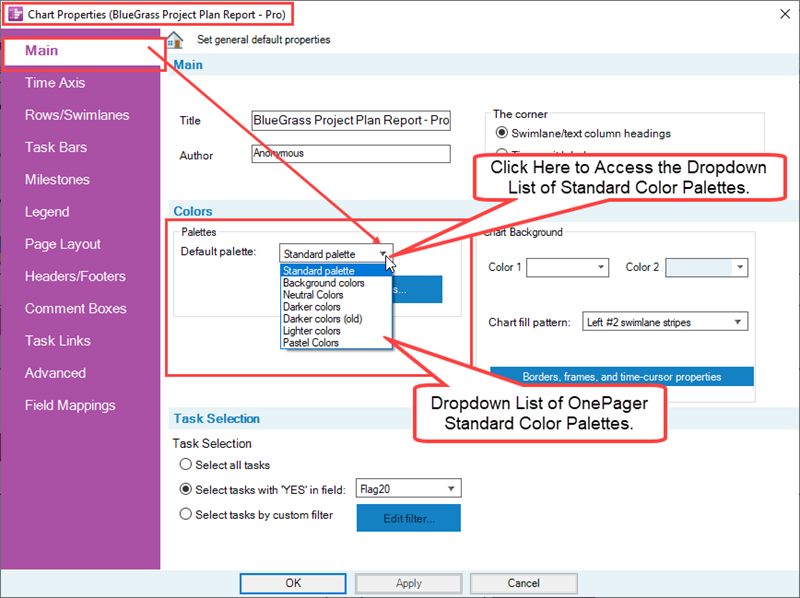
17) OnePager provides a wide variety of color palettes.
18) You can add more palettes, change palettes, or delete unwanted palettes.
19) Clicking the Edit color palettes... button accesses the Color Palette Editor form shown below:
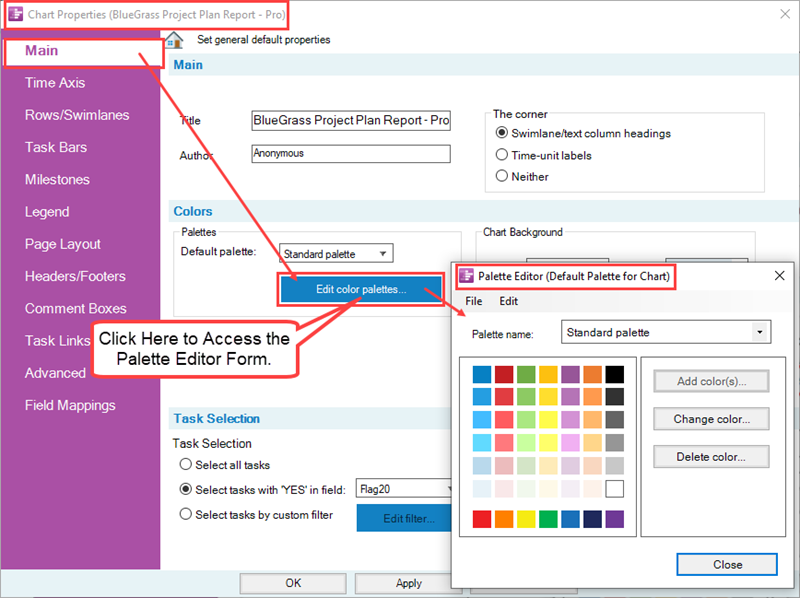
20) This Color Palette Editor form allows you to edit a particular color palette.
21) The File button on the form provides additional palette manipulation functions as shown below:
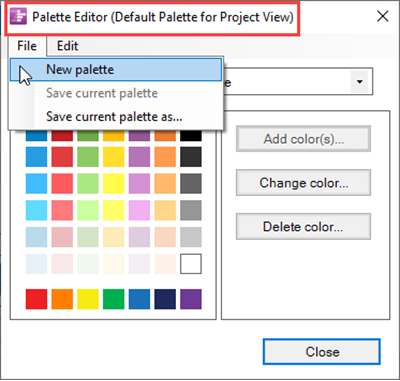
22) The Edit button provides controls for manipulating the colors in the palette as shown below:
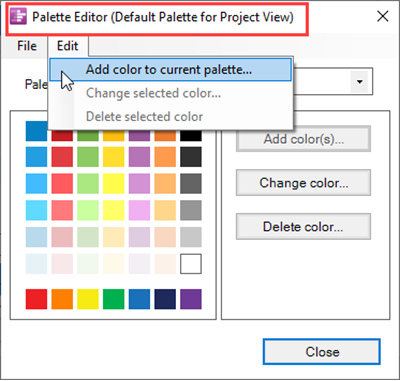
23) For more information on the management and use of color and color palettes, please see the article at: Creating and Saving Color Palettes. 25.0.1-70
Chart Background
Color 1 and Color 2
24) This control group, shown below, allows you to manage the chart's background colors and create various "zebra" striping highlights.
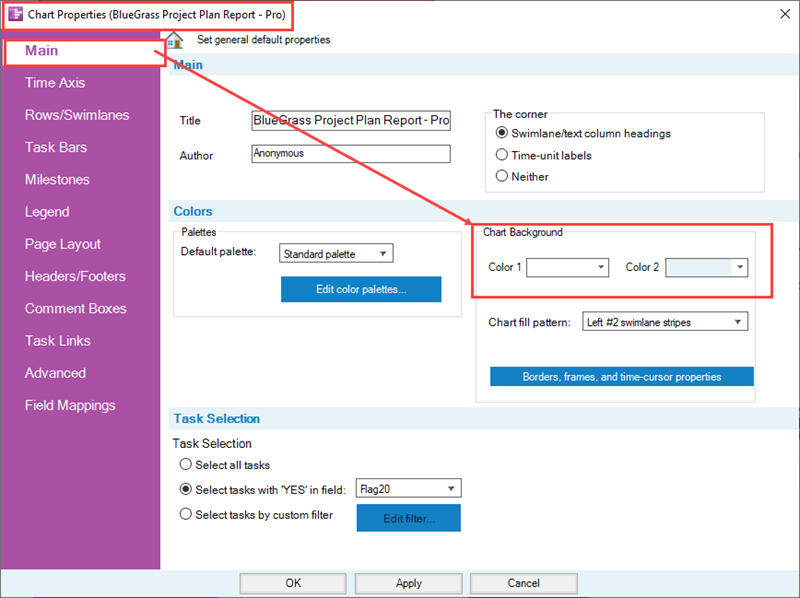
25) To show a phasing or transition of color across the background, choose two colors to blend and choose the blending direction.
26) Alternatively, you can choose to have a single-color background by setting Color 1 and Color 2 to the same color selection.
27) Additionally, this group allows Zebra-striping of rows and swimlane levels.
28) For more information on Zebra-striping, please see the articles at:
| Zebra Striping for Rows and Swimlanes for OnePager Pro 12.23.1-70 | Zebra Striping for Rows and Swimlanes for OnePager Express. 12.24.1-70 |
Chart Fill Pattern
29) The Color fill pattern dropdown list provides the means for using Color 1 and/or Color 2 to create the desired flow of color within the graph area.
- a) There are up to nine (9) Color fill pattern options to select form as shown below:
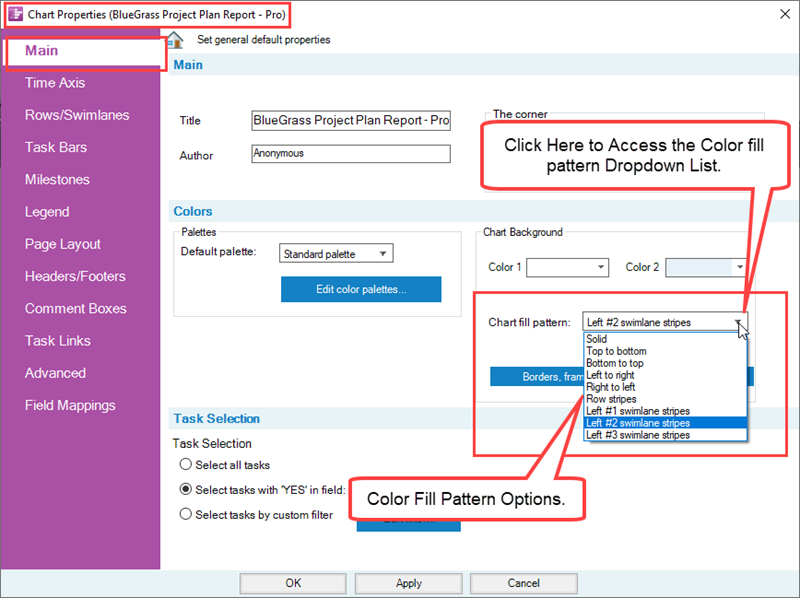
- b) The first five (5) options in the Color fill pattern list provide the means to use Color 1 and Color 2 in various ways across the graph area.
- c) The Row striping option uses Color 1 and Color 2 alternately from the bottom of the chart to the top to create row zebra striping as discussed above.
- d) The three swimlane stripes options for the Left#1, Left#2, and Left#3 swimlane levels also use Color 1 and Color 2 alternately from the bottom of the chart to the top to create swimlane level zebra striping as described above.
- e) For more information on Multiple Swimlane Levels, please see the articles at: Creating and Editing Rows and Swimlanes (Portal) 12.0.1-70.
Borders, Frame, and Time-cursor Properties
Set Line Properties Form
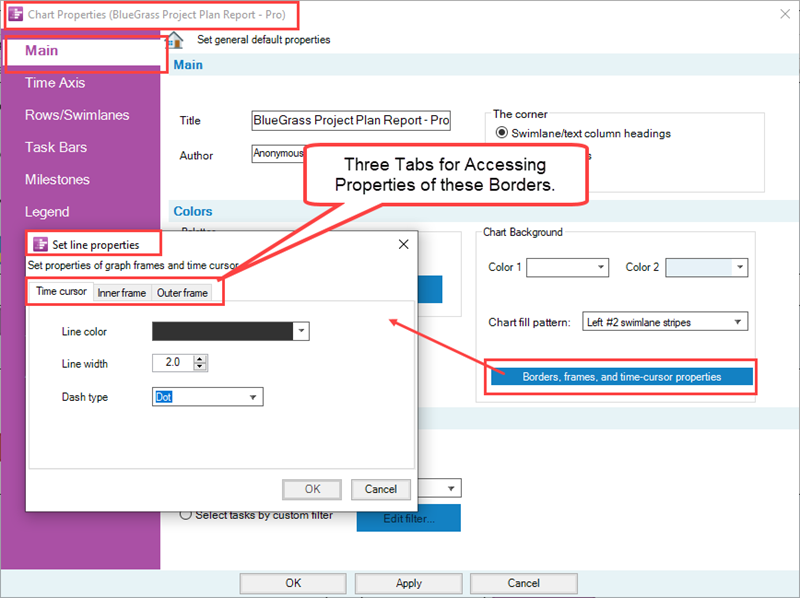
29) Clicking this button accesses the Set line properties form that lets you customize the border properties of various lines for:
- a) The Time Cursor and
- b) The Inner and Outer Frames (the rectangles that surround the graph).
30) The form has three (3) tabs as shown below:
31) For managing the Swimlane Borders and Row Borders for Line color, Line width, Dash type, and Border type the controls are found on the Rows/Swimlanes tab.
32) All these border controls operate like similarly named controls found elsewhere in OnePager.
33) The Time cursor, Inner Frame, and Outer Frame tabs have just the Line color, Line width, Dash type controls.
34) The Set line properties form only sets the properties of these specific graphic elements.
35) Although the Outer and Inner Frames are displayed, it is necessary to manually turn ON the specific controls for Swimlane Borders and Row Borders as well as turn ON the Time Cursor.
36) To turn ON the Row Borders and Swimlane Borders, you need to go to the Chart Properties form Rows/Swimlanes tab where these ON and OFF controls reside.
37) For more information on the Rows/Swimlanes tab, please see the article at: Rows/Swimlane Tab. 21.2.1-70
38) To turn ON the Time cursor, the controlling checkbox is located on the OnePager View ribbon tool bar tab in the Graphic elements group.
39) The Time cursor can also be turned ON by checking the Show time cursor checkbox in the Template Properties and Chart Properties form's Advanced tab.
40) For more information on the Advanced tab, please see the articles at:
| Advanced Tab for OnePager Pro 21.13.1-70 | Advanced Tab-OnePager Express. 21.14.1-70 |
Swimlane Levels and Row Text Columns
41) For clarity, these graphic elements are shown in the illustration below:
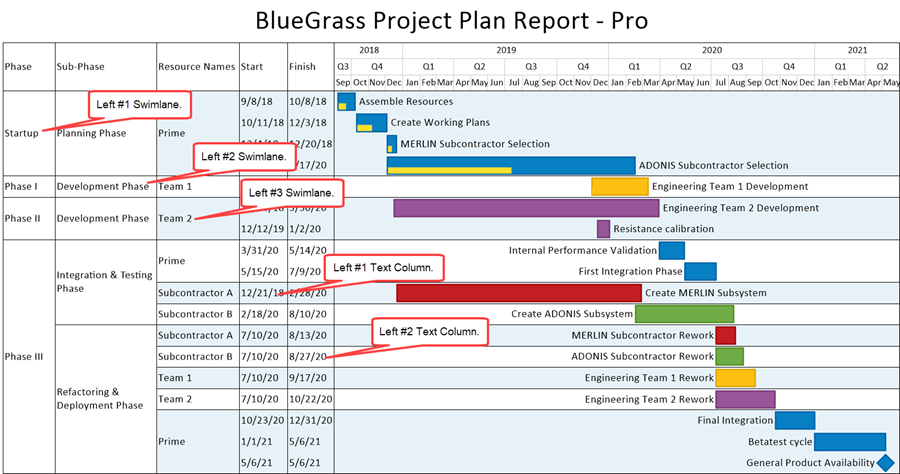
- a) OnePager supports up to three (3) swimlane levels in the chart that are managed in the Rows/Swimlanes tab of the Template Properties and Chart Properties forms.
- b) OnePager also up to supports (5) text columns located to the right of any displayed swimlane level labels that are also managed in the Rows/Swimlanes tab of the Template Properties and Chart Properties forms.
Task Selection Control Group
42) This control tells OnePager which field from the Microsoft Project or Excel source plan to use to control OnePager’s import of data as shown below:
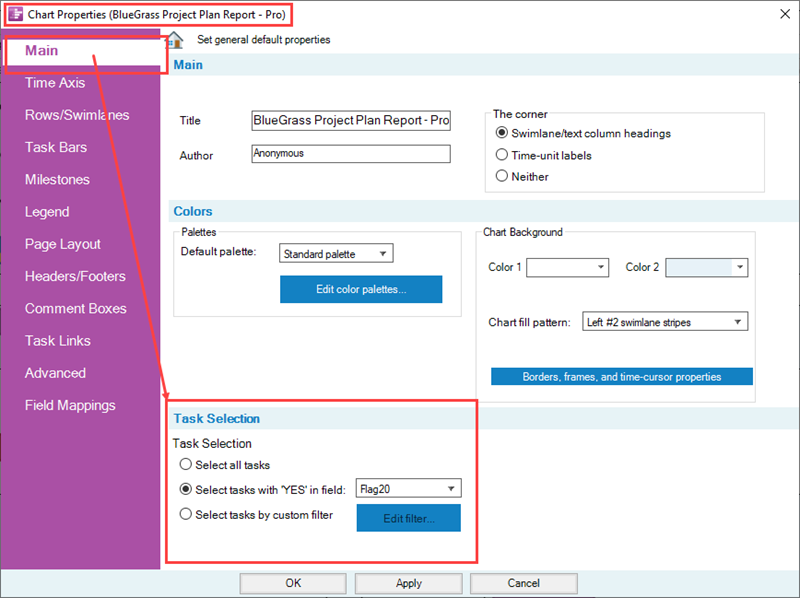
43) Clicking the Select all tasks radio button causes OnePager to import all tasks when an Update of any kind is performed after the chart is created.
44) Clicking the Select task with 'YES' in field: radio button causes OnePager to import tasks using the field named in the dropdown menu window when an Update of any kind is performed after the chart is created.
45) Clicking the Select tasks by custom filter radio button enables the Edit filter... button that access the Condition Import Rules form as shown below:
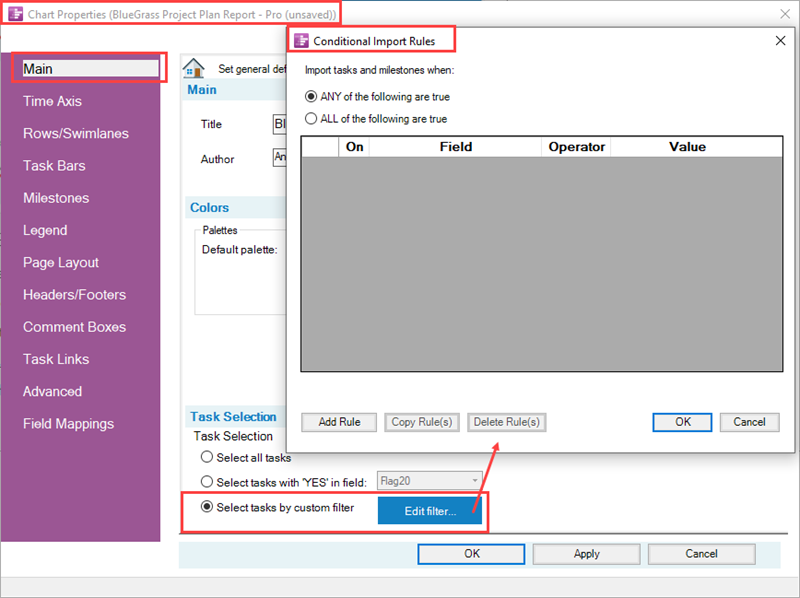
46) For more information on Custom Import Filters, please see the articles at: Conditional Import Filters (Portal). 7.18.1-70
47) Additionally, the settings in this control group show the actions taken with respect to Task Selection when the chart was created.
Related Links
Getting Started (Portal) 3.0.1-70
Creating and Saving Color Palettes 25.0.1-70
Modifying the Time Axis (Portal) 22.0.1-70
Labeling the Corner for OnePager Pro 22.2.3-70
Labeling the Corner for OnePager Express 22.2.4-70
Zebra Striping for Rows and Swimlanes for OnePager Pro 12.23.1-70
Zebra Striping for Rows and Swimlanes for OnePager Express 12.24.1-70
Rows/Swimlane Tab 21.2.1-70
Advanced Tab for OnePager Pro 21.13.1-70
Advanced Tab-OnePager Express 21.14.1-70
Conditional Import Filters (Portal) 7.18.1-70
(21.1.1-70)