Opening an EXISTING OnePager Chart for Version 7.1
Contents
Introduction
This article has five major sections below. The first two major sections are associated with OnePager Pro Add-in and Standalone, respectively. The second two major sections are are associated with OnePager Express Add-in and Standalone, respectively. The fifth major section covers OnePager 360. Please use the table below to accesses the desired sub-section:
| OnePager Pro Add-in |
| OnePager Pro Standalone |
| OnePager Express Add-in |
| OnePager Express Standalone |
| OnePager 360 |
OnePager Pro Add-in
Flow Chart
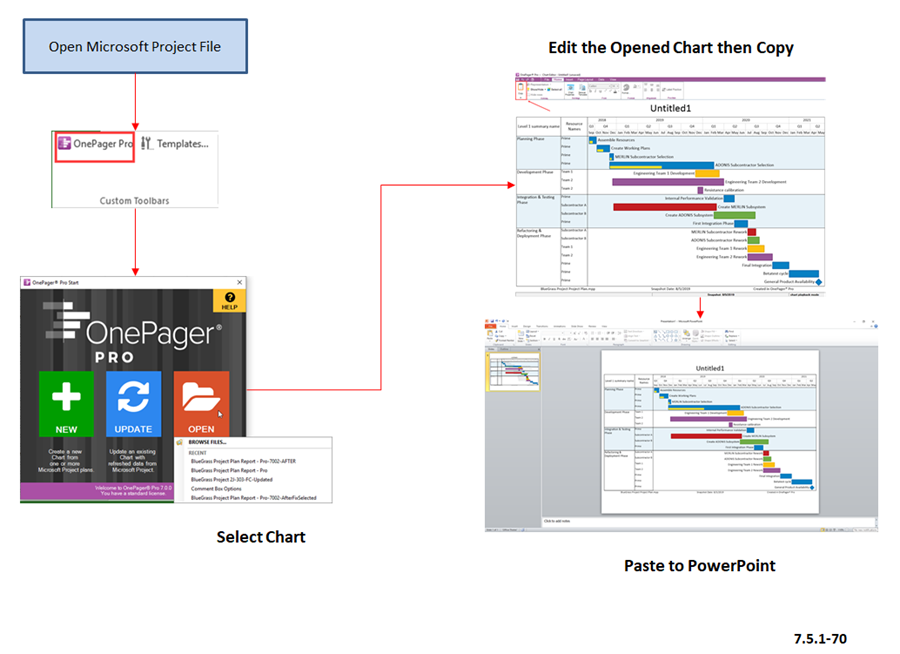
Once charts are created, they can be re-opened from the OnePager Pro Start form. The purpose of this scenario is to retrieve a chart for inclusion in another presentation or to further edit the chart.
This methodology does not import new or old data from Microsoft Project, however, Microsoft Project needs to be launched so that you can access the OnePager Pro button on the Microsoft Project ADD-INS ribbon tool bar tab.
As an alternative, you can double-click on the desired chart’s .TAM file to open an existing chart as described in the article at OnePager Pro Standalone
The steps to open an EXISTING chart from within Microsoft Project are shown below:

Procedures
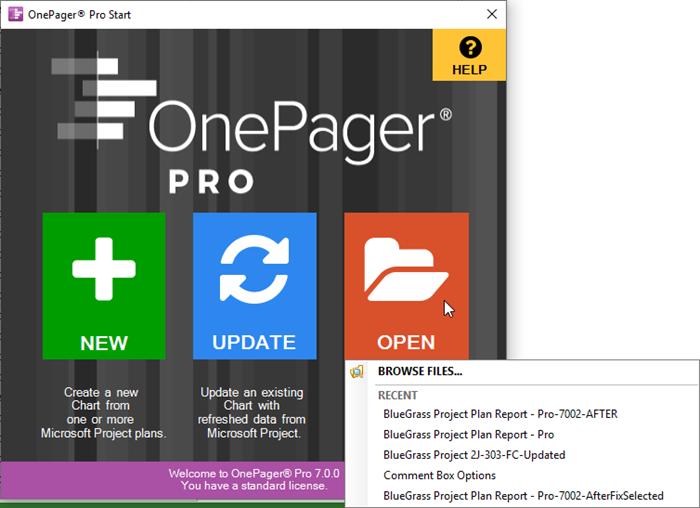
Launch Microsoft Project. With Microsoft Project running, launch OnePager and click the OPEN button on the OnePager Pro Start form. OnePager displays a list of recently-used charts and a BROWSE FILES… option. If you click BROWSE FILES…, you access a Windows Open form where you can select a chart to open.

Selecting a chart to open tells OnePager to load the chart and display it in the Chart Editor. Source plan data will not be imported from the selected Microsoft Project source plan. Once the chart is displayed and available, you can edit, save, and copy the chart to a Microsoft PowerPoint slide or elsewhere as described previously. When a chart with multiple snapshots is opened, you can switch between snapshots. There are two methods to do this.
- 1) The first is to use the forward/back arrows on the OnePager View ribbon tool bar tab to move between snapshot dates.
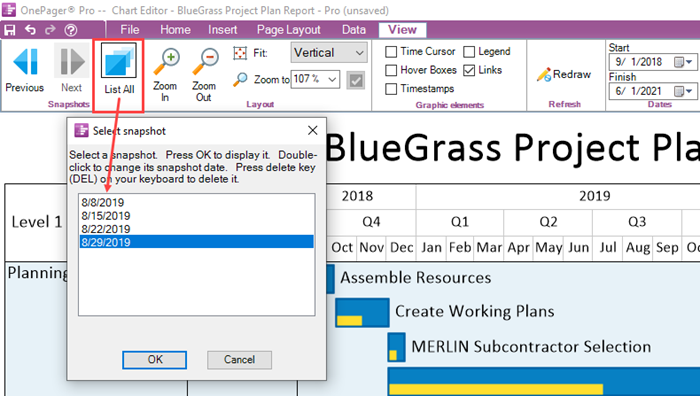
- 2) The second method is to click the List All button on the View ribbon tool bar tab which displays a list of all available snapshot dates for the chart as shown below:

In addition to editing the opened chart and switching between snapshots, you can also use the OnePager Data ribbon tool bar tab to replace snapshots, add snapshots, and perform custom updates. The OnePager Data ribbon tool bar tab appears as shown below:

OnePager Pro Standalone
Flow Chart
Once charts are created, they can be re-opened from the OnePager Pro Start form. The purpose of this scenario is to retrieve a chart for inclusion in another presentation or to further edit the chart. This methodology does not import new or old data from Microsoft Project.
As an alternative, you can double-click on the desired chart’s .TAM file to open an existing chart. The steps to open and EXISTING chart from the desktop are shown below:

Procedure
Launch OnePager from the Desktop Icon or by double-clicking the desired .TAM file. The OnePager splash page appears briefly followed by the OnePager Chart Editor form displaying the OnePager Pro Start form. Click the OPEN button on the OnePager choices (OPC) form. OnePager displays a list of recently-used charts and the word BROWSE FILES… If you click BROWSE FILES…, you access a Windows Open form where you can select a chart to open.

Selecting a chart to open tells OnePager to load the chart and display it in the Chart Editor. Source plan data will not be imported from the selected Microsoft Project source plan. Once the chart is displayed and available, you can edit, save, and copy the chart to a Microsoft PowerPoint slide or elsewhere as described previously. Once a chart with multiple snapshots is opened, you can switch between snapshots. There are two methods to do this.
- 1) The first is to use the forward/back arrows on the OnePager View ribbon tool bar tab to move between snapshot dates.
- 2) The second method is to click the List All button on the View ribbon tool bar tab which displays a list of all available snapshot dates for the chart as shown below:

In addition to editing the opened chart and switching between snapshots you can also use the OnePager Data ribbon tool bar tab to replace snapshots, add snapshots, and perform custom updates. The Data ribbon tool bar tab appears as shown below:

OnePager Express Add-in
Flow Chart
Once charts are created, they can be re-opened from the OnePager Express Start form. The purpose of this scenario is to retrieve a chart for inclusion in another presentation or to further edit the chart. Using this methodology does not import new or old data from Microsoft Excel. However, Microsoft Excel needs to be launched so that you can access the OnePager Express button.
As an alternative you can double-click on the desired chart’s .TAM file to open an existing chart as described in the article at OnePager Express Standalone
The steps to open an EXISTING chart from within Microsoft Excel are shown in the steps below:

Procedures
Launch Microsoft Excel. With Microsoft Excel running, launch OnePager and click the OPEN button on the OnePager Excel Start form. OnePager displays a list of recently-used charts and a BROWSE FILES… option. If you click BROWSE FILES…, you access a Windows Open form where you can select a chart to open.

Selecting a chart to open tells OnePager to retrieve and display it. Source plan data will not be imported from the selected Microsoft Excel source plan. Once the chart is displayed and available, you can edit, save, and copy the chart to a Microsoft PowerPoint slide or elsewhere as described previously. Once a chart with multiple snapshots is opened, you can switch between snapshots. There are two methods to do this.
- 1) The first is to use the forward/back arrows on the OnePager View ribbon tool bar tab to move between snapshot dates.
- 2) The second method is to click the List All button on the OnePager View ribbon tool bar tab which displays a list of all available snapshot dates for the chart as shown below:

In addition to editing the opened chart and switching between snapshots you can also use the OnePager Data ribbon tool bar tab to replace snapshots, add snapshots, and perform custom updates. The Data ribbon tool bar tab appears as shown below:

OnePager Express Standalone
Flow Chart
Once the charts are created, they can be re-opened from the OnePager Express Start form either by launching OnePager from the desktop icon and opening the desired chart or by double-clicking on a .TAM. The purpose of this scenario is to retrieve a chart for inclusion in another presentation or to further edit the chart. Using this methodology will not import new or old data from Microsoft Excel. The steps to open and EXISTING chart are shown in the steps below:

Procedures
Launch OnePager Express from the desktop icon or by double-clicking the desired .TAM file. The OnePager splash page appears briefly followed by the OnePager Chart Editor form displaying the OnePager Express Start form. Click the OPEN button on the OnePager choices (OPC) form. OnePager displays a list of recently-used charts and the word BROWSE FILES… If you click BROWSE FILES…, you access a Windows Open form where you can select a chart to open.

Selecting a chart to open tells OnePager to retrieve and display it. Source plan data will not be imported from the selected Microsoft Excel source plan. Once the chart is displayed and available, you can edit, save, and copy the chart to a Microsoft PowerPoint slide or elsewhere as described previously. Once a chart with multiple snapshots is opened, you can switch between snapshots. There are two methods to do this.
- 1) The first is to use the forward/back arrows on the OnePager View ribbon tool bar tab to move between snapshot dates.
- 2) The second method is to click the List All button on the OnePager View ribbon tool bar tab which displays a list of all available snapshot dates for the chart as shown below:

In addition to editing the opened chart and switching between snapshots you can also use the OnePager Data ribbon tool bar tab to replace snapshots, add snapshots, and perform custom updates. The Data ribbon tool bar tab appears as shown below:

OnePager 360
Flow Chart
TBD
Procedure
TBD
Related Links
Creating a NEW Chart via Pull Operation - OnePager Pro
Creating a NEW Chart via Pull Operation - OnePager Express
REPLACING a Snapshot via Pull Operation - OnePager Pro
REPLACING a Snapshot via Pull Operation - OnePager Express
ADDING a Snapshot via Pull Operation - OnePager Pro
ADDING a Snapshot via Pull Operation - OnePager Express
Custom Update (Replacing) of a Snapshot via Pull Operation - OnePager Pro
Custom Update (Replacing) of a Snapshot via Pull Operation - OnePager Express
Using the OnePager "Data" Tab's "Selected file(s)" Button
(7.5.1-71, 7.5.2-71, 7.6.1-71, 7.6.2-71)