Rows/Swimlane Tab for Version 6.0
Contents
About the Rows and Swimlanes Tab
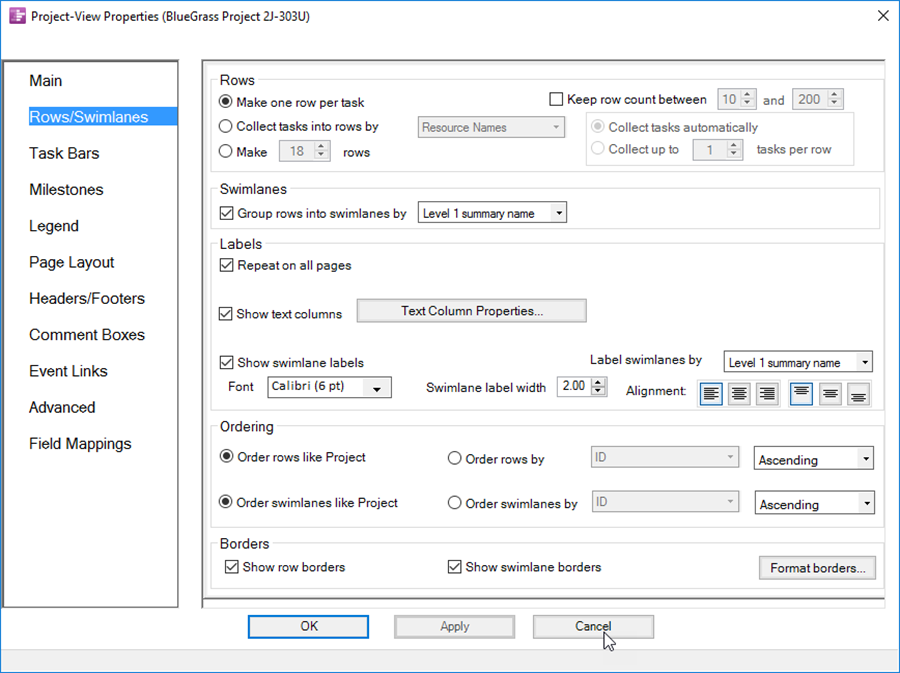
This tab, shown below, lets you control collection of task/milestones into rows, group rows into swimlanes, order rows and swimlanes, manage row/swimlane borders, and label rows and swimlanes.

Rows
1) Rows. The row is the basic horizontal strip where tasks/milestones can be placed.
- a) By far the most common approach is to place one task or milestone in each row.
- b) Additionally, this control group also lets you collect several tasks/milestones into each row based on values from a Microsoft Project or a Microsoft Excel source plan data field.
Swimlanes
2) Swimlanes. Swimlanes are contiguous sets of rows that you can group together using values from a Microsoft Project or Microsoft Excel source plan data field. For example, you can group all rows containing tasks with the same value of Resource Name into a swimlane.
Labels
3) Labels. Rows and swimlanes can have optional labels whose text can be extracted from your Microsoft Project or Microsoft Excel source plan data fields.
- a) For rows, there is an option to construct multiple text columns from data imported from your Microsoft Project or Microsoft Excel source plan.
- b) See the article at: Creating and Editing Rows and Swimlanes (Portal) for more information
- c) Additionally, checking the Repeat on all pages checkbox will place text columns and/or swimlane labels on all pages in a multi-page output.
- d) If this checkbox is unchecked, OnePager will display them only on the left most page of multi-page outputs.
Ordering
4) Ordering. Rows and swimlanes may be ordered in sequences as follows:
- a) Rows are can be ordered in the same sequence as tasks and milestones in imported from your Microsoft Project or Microsoft Excel source plan.
- b) Rows can also be ordered by a set of values you designate from your Microsoft Project or Microsoft Excel source plan data field.
- c) Swimlanes may be ordered in a similar fashion.
Borders and Frames
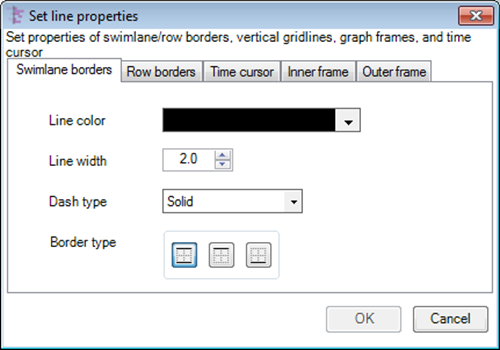
5) Borders and Frames. Clicking the Format borders… button brings the Set line properties form:

- a) In addition to configuring row and swimlane border appearance, this form lets you control the appearance of the time cursor, the inner frame of the graph area and the outer frame of the document area through the various tabs on the form.
- b) There are controls for changing border line color, line width, type of dash pattern, and presence of upper/lower borders.
- c) Border type selections create some interesting combinations when adjacent rows are individually changed.
- d) The same is true for adjacent swimlanes.
- e) Note. When rows adjacent to a swimlane border are being adjusted, care should be taken to make sure that the visual effect is the one desired.
6) For more information on the controls available for borders please see the article at this link: Row and Swimlane Borders
Related Link
Creating and Editing Rows and Swimlanes (Portal)
(21.2.1-60)