Difference between revisions of "Using Rows and Swimlanes for OnePager Version 7.0"
(→Task Layout Sub-Control Group) |
|||
| (153 intermediate revisions by 2 users not shown) | |||
| Line 1: | Line 1: | ||
| − | == | + | ==Using Multiple Level Rows and Swimlanes== |
| − | This article introduces you to OnePager’s rows and swimlane management features. | + | This article introduces you to OnePager’s version 7.0 '''multiple level rows''' and '''swimlane''' management features. Using '''rows''' and '''swimlanes''' is a common way to organize your chart so that task bars and milestone symbols in the '''rows''' can be '''grouped''' together in an organized fashion like a '''work breakdown structure'''. |
| − | + | ===Multiple Swimlane Level Feature=== | |
| − | + | ||
| − | + | OnePager version 7.0 now supports three (3) '''swimlane levels''' versus the one (1) '''swimlane level''' supported in previous versions. An example of a chart with three '''swimlane levels''' is shown below: | |
| − | + | <center>[[File:P70-0_4-70-(20)-03102020.png]]</center> | |
| + | <!--<center>P70-0_4-70-(20)-03102020.png</center>--> | ||
| − | + | Supporting the new '''multiple swimlane level''' feature is a redesigned '''Template Properties''' and ''' Chart Properties''' form's '''Rows/Swimlanes''' tab as shown below: | |
| − | :( | + | <center>[[File:P70-4_0_1_5-70-(0)-04302020.png]]</center> |
| + | <!--<center>P70-4_0_1_5-70-(0)-04302020.png</center>--> | ||
| − | + | ===Schedule Presentation Considerations=== | |
| − | + | It is always important to give consideration to your schedule presentation's '''goals and objectives''' and select the chart organization that best meets these. If you are anticipating using one or more '''swimlane levels''' in a OnePager version 7.0 chart, the organization and structure of the selected '''swimlane levels''' and the information they are to present are key decisions. It may be that no '''swimlane levels''' are need in the chart at all or that just one or two meets your '''goal and objectives'''. Once the desired chart organization is determined, the steps below are provided as guidelines for creating the most beneficial chart. The steps follow the organization of the '''Template Properties''' form and the '''Chart Properties''' form's '''Rows/Swimlanes''' tab such that you can start establishing your settings in the top control group and work your way through them from top to bottom left to right. | |
| − | + | ==Creating Charts Using Rows and Swimlanes== | |
| − | + | As the '''Rows/Swimlanes''' tab above illustrates, there is a step-wise approach to constructing an informative and useful OnePager Pro or Express chart. The general methodology is for you to create or modify the chart by making setting determinations based upon the '''goals and objectives''' you intend to meet with your schedule conversation: | |
| − | + | :1) Determine carefully how the chart is going to look - '''swimlane levels''', '''text columns''', the '''collection''' of task bars into chart '''rows''', and the '''grouping of rows''' into the chart's '''swimlane levels'''. | |
| + | :2) Determine how '''source plan''' tasks are going to be '''collected''' and '''sorted''' into chart '''rows'''. This determination includes determining if only one task bar occupies a chart '''row''' or if multiple task bars occupy a single '''row'''. | ||
| + | :3) Determine how chart's '''rows''' are going to be '''grouped''' into '''swimlane levels'''. | ||
| + | :4) Determine how many '''text columns''' are needed to adequately provide information from the '''source plan''' for the audience without making the chart too busy. | ||
| + | :5) Determine how '''row and swimlane borders''' are going to be '''formatted'''. | ||
| − | + | The five step process suggested above can be iterative as OnePager assists you in these steps because you can always go back to the '''Chart Properties''' form after a chart creation iteration, reassess your settings, and make changes so the chart communicates with respect to your '''goals and objectives'''. The discussion that follows is divided into five (5) sub-sections, one each for the steps listed above. | |
| − | + | ===Step 1 - Determine Carefully How the Chart Should Look=== | |
| − | + | In majority of schedule presentation situations when you anticipate using '''multiple swimlane levels''', the organization of the '''swimlane levels''' and their associated '''source plan''' fields you are going to use are straight forward. When this is not the case, it is recommended that consideration be given to reviewing the '''goals and objectives''' of the schedule conversation where the chart is used and the information needs of audience members. Every schedule presentation situation is different so our suggestion is to spend some time in '''Step 1''' to layout how you are going to address the remaining steps. Adding '''swimlane levels''' can make the chart look busy and distract from the intended theme. Too few '''swimlane levels''' can cloud the message you are trying to communicate. The same logic applies to the determination of how many '''text columns''' to include in the chart. | |
| − | + | Since there are three (3) '''swimlane levels''' available, they appear in the chart from left to right as '''Left#1''', '''Left#2''', and '''Left#3''' as shown in the '''Chart Properties''' form's '''Rows/Swimlanes''' tab above. The '''highest swimlane level''' in a chart is the '''left-most swimlane level''' and successively '''lower swimlane levels''' appear going to the right. This means that you are encouraged to place the '''highest organizational level''' of the chart in the '''left-most swimlane level''' and so on. It can be useful to think of the '''multiple swimlane levels''' in the context of your project's '''Work Breakdown Structure'''. Doing so avoids repeating '''swimlane level cells''' within a '''lower swimlane level cell''' which can make the chart confusing and distract from it communication value. It is also recommended that you use as few '''swimlane levels''' as possible consistent with your schedule conversation message and the makeup of the audience. | |
| − | + | After making these decisions, OnePager keeps track and provides consistent charts whenever you update your '''source plan''' and create an additional or modified snapshot. | |
| − | 2 | + | ===Step 2 – Collect Source Plan Tasks into OnePager Chart Rows=== |
| − | + | '''Collecting source plan''' tasks into '''rows''' in the chart is usually done by selecting the '''Gantt chart layout''' where each chart '''row''' contains one task bar. You have the option to use the '''Timeline''' layout where multiple task bars occupy one '''row''' in the chart. | |
| − | + | ====Task Layout Sub-Control Group==== | |
| − | + | The controls for making these settings are found in the '''Template Properties''' form or '''Chart Properties''' form at the '''Rows/Swimlanes''' tab's '''Rows''' control group's '''Task Layout''' sub-control group shown below: | |
| − | + | <center>[[File:P70-4_0_1_5-70-(1)-04302020.png]]</center> | |
| + | <!--<center>P70-4_0_1_5-70-(1)-04302020.png</center>--> | ||
| − | + | For more information on '''Collecting Tasks into Rows''', please see these articles at: [[Creating and Editing Rows and Swimlanes for Version 7.0 (Portal) | Creating and Editing Rows and Swimlanes (Portal)]] <!--12.0.1-70--> and [[Collecting, Formatting, and Sorting Task/Milestones into Rows for Version 7.0 | Collecting, Formatting, and Sorting Task/Milestones into Rows]] <!--12.01.1-70-->. | |
| − | + | ====Row Border Formatting...==== | |
| − | + | The '''Row Border Formatting...''' button accesses the '''Row Formatting''' form as shown below: | |
| − | + | <center>[[File:P70-4_0_1_5-70-(4)-05012020.png]]</center> | |
| + | <!--<center>P70-4_0_1_5-70-(4)-05012020.png</center>--> | ||
| − | + | '''Row borders''' can be set at this point. However, we recommend setting '''row and swimlane level borders''' in '''Step 5''' discussed below. For more information on '''Row borders''', please see the article at: [[Row and Swimlane Borders for Version 7.0 | Row and Swimlane Borders]] <!--12.04.1-70. | |
| − | + | ====Row Sorting Sub-Control Group==== | |
| − | + | Once the selection between '''Gantt chart''' and '''Timeline''' layout is made, you have additional controls over how '''rows''' are '''sorted'''. Most OnePager Pro users select the option to '''Sort rows like Project''' to maintain correspondence with their '''source plan''' organization. Most OnePager Express users select the option to '''Sort rows like Excel''' for the same reason. Selecting the '''Sort on field:''' allows you to select a '''source plan''' field upon which to base the '''sorting of rows''' in the chart. | |
| − | + | '''Rows''' are '''sorted''' chart-wise if there are no '''swimlane levels''' present. When one or more '''swimlane levels''' are present in the chart, '''rows are sorted''' '''within''' the lowest swimlane level only'''. There are implications on '''sorting rows within the lowest swimlane level''' when there are task bars containing '''duplicate source plan field values''' in the set to be '''sorted'''. | |
| − | + | ||
| − | + | ||
| − | + | ||
| − | + | For more information on '''collecting and sorting source plan tasks into OnePager chart rows''', please see the article at: [[Creating, Formatting, and Sorting Swimlanes Levels for Version 7.0 | Creating, Formatting, and Sorting Swimlanes Levels <!--12.02.1-70. | |
| − | + | After task bar '''collection''' into chart '''rows''' and the '''sorting of rows''' are determined, you can move on to determine how chart '''rows''' should be '''grouped''' into '''swimlane levels'''. | |
| − | ==Step 3 – | + | ===Step 3 – Group Chart Rows into Swimlane Levels=== |
| − | + | When the decision is made to incorporate '''swimlane levels''' in the chart as well as the number of '''swimlane levels''', you can use the '''Swimlanes''' control group in the '''Chart Properties''' form's '''Rows/Swimlanes''' tab to implement these decisions. The '''Chart Properties''' form's '''Rows/Swimlanes''' tab's '''Swimlanes''' control group is shown below: | |
| − | :( | + | <center>[[File:P70-4_0_1_5-70-(2)-04302020.png]]</center> |
| + | <!--<center>P70-4_0_1_5-70-(2)-04302020.png</center>--> | ||
| − | + | ====Swimlane Level Sub-Tabs==== | |
| − | + | Each '''sub-tab''' shown above as '''Left#1''', '''Left#2''', and '''Left#3''' are identical in terms of their controls. Checking the '''Group by''' checkbox '''ON''' in the '''sub-tab enables''' the '''swimlane level''' and the other controls in the '''sub-tab'''. Use the window dropdown next to the '''Group by''' checkbox to implement your '''swimlane level''' decision with respect to how the chart's '''rows''' are '''grouped''' with respect to the '''source plan''' field to be used. | |
| − | + | For more information on '''grouping chart rows into swimlane levels''', please see the article at: [[Grouping Rows into Swimlanes for Version 7.0 | Grouping Rows into Swimlanes]] <!--12.18.1-70--> | |
| − | + | ====Swimlane Formatting...==== | |
| − | + | You can now use the '''Swimlane Formatting...''' button to access the '''Swimlane Formatting - Left#n''' form to make settings pertaining to '''swimlane level heading cell labeling''', '''swimlane level cell labeling''', and '''swimlane level border''' settings as shown below: | |
| − | + | <center>[[File:P70-4_0_1_5-70-(3)-04302020.png]]</center> | |
| + | <!--<center>P70-4_0_1_5-70-(3)-04302020.png</center>--> | ||
| − | + | Note in the illustration above that the form's title includes the '''swimlane level number'''. The '''Column Heading''' control group in the above form contains all the controls for OnePager to set the '''swimlane level heading cell's label''' or for you to select the '''text content''' for this location in the chart. Additionally, all the '''text formatting''' controls are provided in this sub-group. The '''Swimlane Text''' control group shown above in the middle section of the form, contains all the controls for setting the '''swimlane level cell's labels''' within the '''swimlane level'''. | |
| − | : | + | The '''Label by:''' checkbox must be checked '''ON''' for the '''swimlane level''' to be '''shown''' in the chart and for the other controls in this control group to be '''enabled'''. As with the '''Column Heading''' control group, the '''Swimlane Text''' control group contains all the '''text formatting''' controls for the '''text content''' of '''swimlane level cells for level n''' in the chart. |
| − | + | The '''Swimlane Borders''' control group in the bottom section of the this form has all the controls for managing the '''borders''' associated with the '''swimlane level''' selected. However, we recommend setting '''row and swimlane level borders''' in '''Step 5''' discussed below. | |
| − | + | For more information on '''formatting swimlane components''', please see the article at: [[Creating, Formatting, and Sorting Swimlanes Levels for Version 7.0 | Creating, Formatting, and Sorting Swimlanes Levels]] <!--12.02.1-70--> | |
| − | + | ====Swimlane Sorting Sub-Control Group==== | |
| − | + | ||
| − | : | + | '''Swimlane sorting''' is done within '''swimlane levels''' involving all the '''rows''' found in the '''swimlane level'''. There are two '''swimlane level sorting''' options for OnePager Pro: (1) '''Sort swimlanes like Project''' or (2) '''Sort on field'''. For OnePager Express the '''swimlane level sorting''' options are: (1) '''Sort swimlanes like Excel''' or (2) '''Sort on field'''. Most OnePager Pro users select the option to '''Sort swimlanes like Project''' to maintain correspondence with their '''source plan''' organization. OnePager Express users select the option to '''Sort swimlanes like Excel''' for the same reason. Selecting the '''Sort on field:''' allows you to select a '''source plan''' field upon which to base the '''sorting of swimlane levels''' in the chart. The options for '''sorting swimlane levels''' is only available if the '''swimlane level''' is '''showing''' in the chart. |
| − | + | When one or more '''swimlane levels''' are present in the chart, '''rows are sorted''' '''within''' each '''swimlane level''' where '''sorting''' is to be performed by OnePager. Care should be exercised when '''sorting swimlane levels''' where there are '''multiple swimlane levels''' present in the chart. | |
| − | + | For more information on '''sorting swimlane levels''', please see the article at: [[Creating, Formatting, and Sorting Swimlanes Levels for Version 7.0 | Creating, Formatting, and Sorting Swimlanes Levels]] <!--12.02.1-70--> | |
| − | + | ===Step 4 – Determine Text Column Needs=== | |
| − | + | ||
| − | + | There are five (5) optional '''Text Columns''' that you can place to the right of any '''shown swimlane levels''' and to the left of the '''graph'''. Their purpose is to highlight information pertinent to '''rows''' in the '''graph''' and the task bars and/or milestone symbols in the chart's '''rows'''. A typical example for the content of two '''text columns''' is to show task bar '''start date''' and '''finish date''' as illustrated in the partial chart below: | |
| − | : | + | <center>[[File:P70-0_4_1-(7)-06112020.png]]</center> |
| + | <!--<center>P70-0_4_1-(7)-06112020.png</center>--> | ||
| − | + | The controls for managing '''text columns''' are found in the '''Template Properties''' and '''Chart Properties''' form's '''Rows/Swimlanes''' tab at the '''Text Columns''' control group shown here: | |
| − | + | <center>[[File:P70-4_0_1_5-70-(6)-05012020.png]]</center> | |
| + | <!--<center>P70-4_0_1_5-70-(6)-05012020.png</center>--> | ||
| − | + | ====Text Columns Sub-Tabs==== | |
| − | + | Each '''sub-tab''' shown above as '''Left#1''', '''Left#2''', '''Left#3''', '''Left#4''', and '''Left#5''' are identical in terms of their controls. Checking the '''Display data from''' checkbox '''ON''' in the '''sub-tab enables''' the '''text column''' and the other controls in the '''sub-tab'''. Use the window dropdown next to the '''Display data from''' checkbox to implement your '''text column''' decisions with respect to the '''source plan''' data for the task bar or milestone symbol that are displayed. | |
| − | + | For more information on '''text columns''', please see the article at: [[Editing Text Columns or Swimlane Labels for Version 7.0 | Editing Text Columns or Swimlane Labels]] <!--12.3.1-70--> | |
| − | + | ====Text Column Formatting...==== | |
| − | + | You can now use the '''Text Column Formatting...''' button to access the '''Text Column Formatting - Left#n''' form to make settings pertaining to '''text column heading cell labeling''' and '''text column cell labeling''' settings as shown below: | |
| − | + | <center>[[File:P70-4_0_1_5-70-(7)-05012020.png]]</center> | |
| + | <!--<center>P70-4_0_1_5-70-(7)-05012020.png</center>--> | ||
| − | + | Note in the illustration above that the form's title includes the '''text column number'''. The '''Column Heading''' control group in the above form contains all the controls for OnePager to set the '''text column heading cell's label''' or for you to select the '''text content''' for this location in the chart. Additionally, all the '''text formatting''' controls are provided in this sub-group. The '''Column Text''' control group shown above in the bottom section of the form contains all the controls for setting the '''text columns cell's labels''' within the '''text column'''. As with the '''Column Heading''' control group, the '''Column Text''' control group contains all the '''text formatting''' controls for the '''text content''' of '''text column cells for level n''' in the chart. | |
| − | + | There are no '''border controls''' in this form as '''text columns''' are considered part of a chart's '''row''' and the controls for '''row borders''' are contained in the '''Rows''' control group of the '''Chart Properties''' form's '''Rows/Swimlanes''' tab. | |
| − | + | For more information on '''formatting text columns''', please see these articles at: | |
| − | + | <center> | |
| + | {| class="wikitable" | ||
| + | | [[Snapshot-Dependent Text Columns for OnePager Pro for Version 7.0 | Snapshot-Dependent Text Columns for OnePager Pro]] <!--12.4.1-70--> | ||
| + | | [[Snapshot-Dependent Text Columns for OnePager Express for Version 7.0 | Snapshot-Dependent Text Columns for OnePager Express]] <!--12.4.2-70--> | ||
| + | |- | ||
| + | | [[Resizing the Width of Text Columns and Swimlanes for Version 7.0 | Resizing the Width of Text Columns and Swimlanes]] <!--12.8.1-70--> | ||
| + | |} | ||
| + | </center> | ||
| − | + | ====Text Type Formatting for Date and Numeric Formats==== | |
| − | + | When a '''text column's''' designated '''source plan''' field is a '''date type field''', the '''Text Columns''' sub-group in the main form has an additional sub-group added for you to '''edit''' the '''date field''' as it appears in the '''text column cells'''. This is shown in the illustration below: | |
| − | + | <center>[[File:P70-4_0_1_5-70-(6)-05012020.png]]</center> | |
| + | <!--<center>P70-4_0_1_5-70-(6)-05012020.png</center>--> | ||
| − | + | When a '''text column's''' designated '''source plan''' field is a '''numeric type field''', the '''Text Columns''' sub-group in the main form has an additional sub-group added for you to '''edit''' the '''numeric field''' as it appears in the '''text column cells'''. This is shown in the illustration below: | |
| − | : | + | <center>[[File:P70-4_0_1_5-70-(8)-05012020.png]]</center> |
| + | <!--<center>P70-4_0_1_5-70-(8)-05012020.png</center>--> | ||
| − | + | ===Step 5 – Formatting Row and Swimlane Level Borders=== | |
| − | + | As the final step in preparing your schedule discussion presentation chart with '''rows''' and '''swimlane levels''' is to choose '''row''' and '''swimlane borders'''. | |
| − | + | ====Formatting Row Borders==== | |
| − | : | + | To format '''row borders''' click the '''Row Borders Formatting... button in the '''Rows''' control group of the '''Chart Properties''' form's '''Rows/Swimlanes''' tab to acccess the '''Row borders''' form again shown here: |
| − | : | + | <center>[[File:P70-4_0_1_5-70-(9)-05012020.png]]</center> |
| + | <!--<center>P70-4_0_1_5-70-(9)-05012020.png</center>--> | ||
| − | + | To '''show all row borders''' including the '''borders in text columns''', check the '''Show Row Borders''' checkbox '''ON'''. This '''enables''' all the controls in the form. These controls include using the OnePager standard '''Color Chooser''' form to select the '''color''' for the '''row borders''', the '''width''' control for the thickness of the '''row borders''', and the '''Dash-type''' which has five (5) options. These controls apply to both the '''top and bottom row borders'''. Be aware that '''row borders''' may be shared with '''swimlane level borders''' whose controls are discussed shortly. | |
| − | + | ====Formatting Swimlane Level Borders==== | |
| − | + | '''Swimlane border controls''' are provided for each '''swimlane level showing''' in the chart up to three (3). This means that there are three (3) '''Swimlane Formatting...''' forms available, one for each possible '''swimlane level''' shown. When the '''Swimlane Formatting...''' button is clicked, the associated '''Swimlane Formatting...''' form is accessed as shown below: | |
| − | : | + | <center>[[File:P70-4_0_1_5-70-(10)-05012020.png]]</center> |
| + | <!--<center>P70-4_0_1_5-70-(10)-05012020.png</center>--> | ||
| − | + | To '''show a swimlane level's borders''', check the '''Show Borders''' checkbox '''ON'''. This '''enables''' all the controls in the form. These controls include using the OnePager standard '''Color Chooser''' form to select the '''color''' for the '''swimlane level borders''', the '''width''' control for the thickness of the '''swimlane level borders''', and the '''Dash-type''' which has five (5) options. These controls apply to both the '''top and bottom swimlane level borders'''. '''Caution:''' Be aware that '''swimlane level borders''' may be shared with other '''swimlane level borders''' and with '''row borders''' as mentioned above. | |
| − | : | + | For more information on managing '''swimlane level borders''', please see the article at: [[Row and Swimlane Borders for Version 7.0 | Row and Swimlane Borders]] <!--12.04.1-70--> |
| − | + | ====Other Borders in the Chart==== | |
| − | + | The '''Inner Frame border''' and the '''Outer Frame border''' of the chart are managed by the controls in the '''Template Properties''' and '''Chart Properties''' form's '''Main''' tab's '''Borders, frames, and time cursor properties''' button which accesses the '''Set line properties''' form shown here: | |
| − | + | ||
| − | + | ||
| − | + | <center>[[File:P70-4_0_1_5-70-(11)-05012020.png]]</center> | |
| − | <center>[[File: | + | <!--<center>P70-4_0_1_5-70-(11)-05012020.png</center>--> |
| − | <center> | + | |
| − | + | For more information on managing '''Inner and Outer chart borders''', please see the article at: [[Main Tab for Version 7.0 | Main Tab]] <!--21.1.1-70--> | |
| − | + | ||
| − | + | ||
| − | + | ==Related Links== | |
| − | + | ||
| − | + | ||
| − | + | [[Creating and Editing Rows and Swimlanes for Version 7.0 (Portal) | Creating and Editing Rows and Swimlanes (Portal)]] <!--12.0.1-70--> | |
| − | + | ||
| − | + | ||
| − | + | [[About OnePager's Rows and Swimlanes | About OnePager's Rows and Swimlanes]] <!--12.0.2-70--> | |
| − | + | [[Collecting Tasks/Milestones into Rows for Version 7.0 | Collecting Tasks/Milestones into Rows]] <!--12.1.1-70--> | |
| − | + | [[Editing Text Columns or Swimlane Labels for Version 7.0 | Editing Text Columns or Swimlane Labels]] <!--12.3.1-70--> | |
| − | + | ||
| − | 7 | + | [[Snapshot-Dependent Text Columns for OnePager Pro for Version 7.0 | Snapshot-Dependent Text Columns for OnePager Pro]] <!--12.4.1-70--> |
| − | < | + | [[Snapshot-Dependent Text Columns for OnePager Express for Version 7.0 | Snapshot-Dependent Text Columns for OnePager Express]] <!--12.5.1-70--> |
| − | < | + | |
| + | [[Row and Swimlane Sorting for Version 7.0 | Row and Swimlane Sorting]] <!--12.6.1-70--> | ||
| + | |||
| + | [[Row and Swimlane Borders for Version 7.0 | Row and Swimlane Borders]] <!--12.7.1-70--> | ||
| + | |||
| + | [[Resizing the Width of Text Columns and Swimlanes for Version 7.0 | Resizing the Width of Text Columns and Swimlanes]] <!--12.8.1-70--> | ||
| + | |||
| + | [[Grouping Rows into Swimlanes for Version 7.0 | Grouping Rows into Swimlanes]] <!--12.18.1-70--> | ||
| + | |||
| + | [[Main Tab for Version 7.0 | Main Tab]] <!--21.1.1-70--> | ||
(4.0.1.5-70) | (4.0.1.5-70) | ||
| Line 208: | Line 225: | ||
[[Category:Task/Milestone Editing]] | [[Category:Task/Milestone Editing]] | ||
[[Category:Rows and Swimlanes]] | [[Category:Rows and Swimlanes]] | ||
| + | [[Category:Multiple Swimlane Levels]] | ||
[[Category:Swimlane Labels]] | [[Category:Swimlane Labels]] | ||
| − | |||
[[Category:Additional Text Columns]] | [[Category:Additional Text Columns]] | ||
[[Category:Row/Swimlane Borders]] | [[Category:Row/Swimlane Borders]] | ||
[[Category:OnePager Pro]] | [[Category:OnePager Pro]] | ||
[[Category:OnePager Express]] | [[Category:OnePager Express]] | ||
Latest revision as of 15:17, 26 February 2021
Contents
- 1 Using Multiple Level Rows and Swimlanes
- 2 Creating Charts Using Rows and Swimlanes
- 3 Related Links
Using Multiple Level Rows and Swimlanes
This article introduces you to OnePager’s version 7.0 multiple level rows and swimlane management features. Using rows and swimlanes is a common way to organize your chart so that task bars and milestone symbols in the rows can be grouped together in an organized fashion like a work breakdown structure.
Multiple Swimlane Level Feature
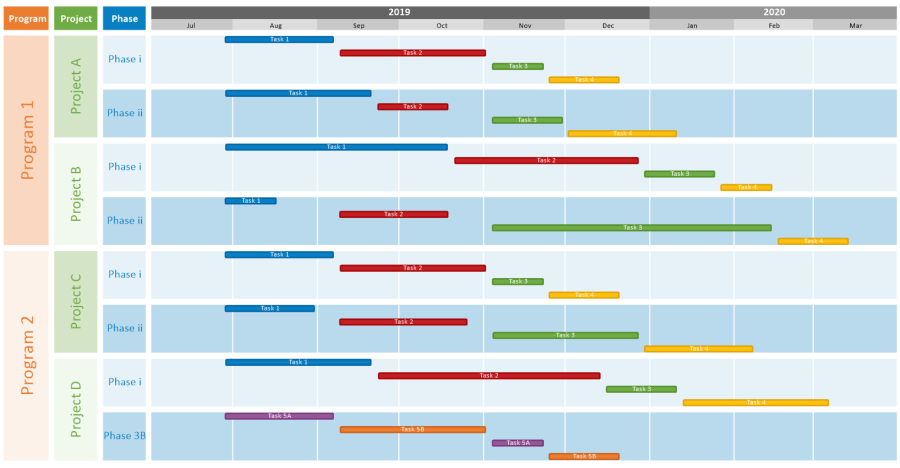
OnePager version 7.0 now supports three (3) swimlane levels versus the one (1) swimlane level supported in previous versions. An example of a chart with three swimlane levels is shown below:
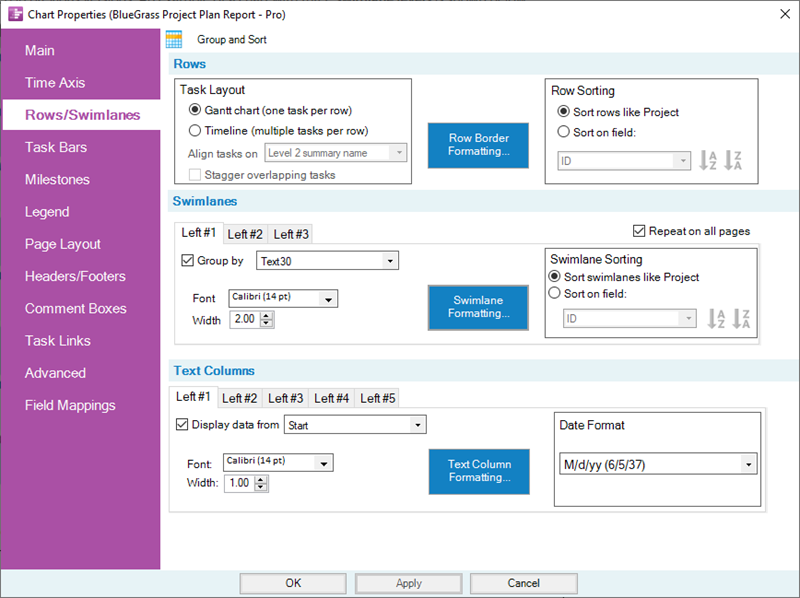
Supporting the new multiple swimlane level feature is a redesigned Template Properties and Chart Properties form's Rows/Swimlanes tab as shown below:
Schedule Presentation Considerations
It is always important to give consideration to your schedule presentation's goals and objectives and select the chart organization that best meets these. If you are anticipating using one or more swimlane levels in a OnePager version 7.0 chart, the organization and structure of the selected swimlane levels and the information they are to present are key decisions. It may be that no swimlane levels are need in the chart at all or that just one or two meets your goal and objectives. Once the desired chart organization is determined, the steps below are provided as guidelines for creating the most beneficial chart. The steps follow the organization of the Template Properties form and the Chart Properties form's Rows/Swimlanes tab such that you can start establishing your settings in the top control group and work your way through them from top to bottom left to right.
Creating Charts Using Rows and Swimlanes
As the Rows/Swimlanes tab above illustrates, there is a step-wise approach to constructing an informative and useful OnePager Pro or Express chart. The general methodology is for you to create or modify the chart by making setting determinations based upon the goals and objectives you intend to meet with your schedule conversation:
- 1) Determine carefully how the chart is going to look - swimlane levels, text columns, the collection of task bars into chart rows, and the grouping of rows into the chart's swimlane levels.
- 2) Determine how source plan tasks are going to be collected and sorted into chart rows. This determination includes determining if only one task bar occupies a chart row or if multiple task bars occupy a single row.
- 3) Determine how chart's rows are going to be grouped into swimlane levels.
- 4) Determine how many text columns are needed to adequately provide information from the source plan for the audience without making the chart too busy.
- 5) Determine how row and swimlane borders are going to be formatted.
The five step process suggested above can be iterative as OnePager assists you in these steps because you can always go back to the Chart Properties form after a chart creation iteration, reassess your settings, and make changes so the chart communicates with respect to your goals and objectives. The discussion that follows is divided into five (5) sub-sections, one each for the steps listed above.
Step 1 - Determine Carefully How the Chart Should Look
In majority of schedule presentation situations when you anticipate using multiple swimlane levels, the organization of the swimlane levels and their associated source plan fields you are going to use are straight forward. When this is not the case, it is recommended that consideration be given to reviewing the goals and objectives of the schedule conversation where the chart is used and the information needs of audience members. Every schedule presentation situation is different so our suggestion is to spend some time in Step 1 to layout how you are going to address the remaining steps. Adding swimlane levels can make the chart look busy and distract from the intended theme. Too few swimlane levels can cloud the message you are trying to communicate. The same logic applies to the determination of how many text columns to include in the chart.
Since there are three (3) swimlane levels available, they appear in the chart from left to right as Left#1, Left#2, and Left#3 as shown in the Chart Properties form's Rows/Swimlanes tab above. The highest swimlane level in a chart is the left-most swimlane level and successively lower swimlane levels appear going to the right. This means that you are encouraged to place the highest organizational level of the chart in the left-most swimlane level and so on. It can be useful to think of the multiple swimlane levels in the context of your project's Work Breakdown Structure. Doing so avoids repeating swimlane level cells within a lower swimlane level cell which can make the chart confusing and distract from it communication value. It is also recommended that you use as few swimlane levels as possible consistent with your schedule conversation message and the makeup of the audience.
After making these decisions, OnePager keeps track and provides consistent charts whenever you update your source plan and create an additional or modified snapshot.
Step 2 – Collect Source Plan Tasks into OnePager Chart Rows
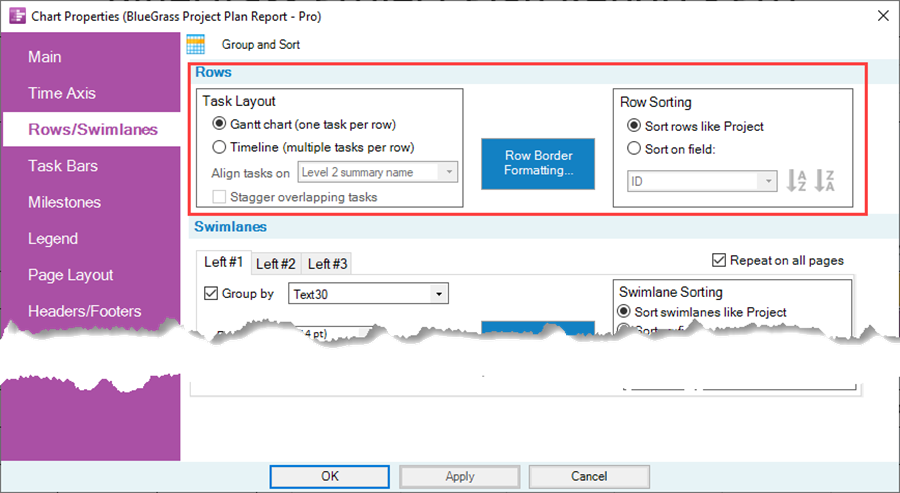
Collecting source plan tasks into rows in the chart is usually done by selecting the Gantt chart layout where each chart row contains one task bar. You have the option to use the Timeline layout where multiple task bars occupy one row in the chart.
Task Layout Sub-Control Group
The controls for making these settings are found in the Template Properties form or Chart Properties form at the Rows/Swimlanes tab's Rows control group's Task Layout sub-control group shown below:
For more information on Collecting Tasks into Rows, please see these articles at: Creating and Editing Rows and Swimlanes (Portal) and Collecting, Formatting, and Sorting Task/Milestones into Rows .
Row Border Formatting...
The Row Border Formatting... button accesses the Row Formatting form as shown below:
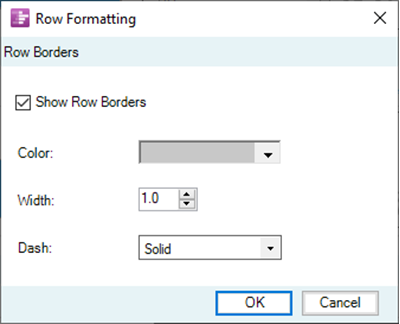
Row borders can be set at this point. However, we recommend setting row and swimlane level borders in Step 5 discussed below. For more information on Row borders, please see the article at: Row and Swimlane Borders
Swimlane Level Sub-Tabs
Each sub-tab shown above as Left#1, Left#2, and Left#3 are identical in terms of their controls. Checking the Group by checkbox ON in the sub-tab enables the swimlane level and the other controls in the sub-tab. Use the window dropdown next to the Group by checkbox to implement your swimlane level decision with respect to how the chart's rows are grouped with respect to the source plan field to be used.
For more information on grouping chart rows into swimlane levels, please see the article at: Grouping Rows into Swimlanes
Swimlane Formatting...
You can now use the Swimlane Formatting... button to access the Swimlane Formatting - Left#n form to make settings pertaining to swimlane level heading cell labeling, swimlane level cell labeling, and swimlane level border settings as shown below:
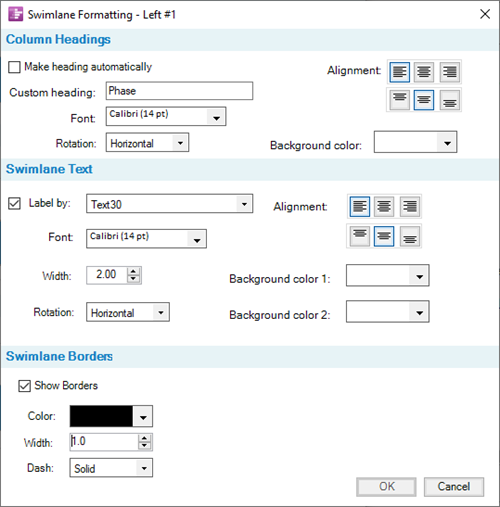
Note in the illustration above that the form's title includes the swimlane level number. The Column Heading control group in the above form contains all the controls for OnePager to set the swimlane level heading cell's label or for you to select the text content for this location in the chart. Additionally, all the text formatting controls are provided in this sub-group. The Swimlane Text control group shown above in the middle section of the form, contains all the controls for setting the swimlane level cell's labels within the swimlane level.
The Label by: checkbox must be checked ON for the swimlane level to be shown in the chart and for the other controls in this control group to be enabled. As with the Column Heading control group, the Swimlane Text control group contains all the text formatting controls for the text content of swimlane level cells for level n in the chart.
The Swimlane Borders control group in the bottom section of the this form has all the controls for managing the borders associated with the swimlane level selected. However, we recommend setting row and swimlane level borders in Step 5 discussed below.
For more information on formatting swimlane components, please see the article at: Creating, Formatting, and Sorting Swimlanes Levels
Swimlane Sorting Sub-Control Group
Swimlane sorting is done within swimlane levels involving all the rows found in the swimlane level. There are two swimlane level sorting options for OnePager Pro: (1) Sort swimlanes like Project or (2) Sort on field. For OnePager Express the swimlane level sorting options are: (1) Sort swimlanes like Excel or (2) Sort on field. Most OnePager Pro users select the option to Sort swimlanes like Project to maintain correspondence with their source plan organization. OnePager Express users select the option to Sort swimlanes like Excel for the same reason. Selecting the Sort on field: allows you to select a source plan field upon which to base the sorting of swimlane levels in the chart. The options for sorting swimlane levels is only available if the swimlane level is showing in the chart.
When one or more swimlane levels are present in the chart, rows are sorted within each swimlane level where sorting is to be performed by OnePager. Care should be exercised when sorting swimlane levels where there are multiple swimlane levels present in the chart.
For more information on sorting swimlane levels, please see the article at: Creating, Formatting, and Sorting Swimlanes Levels
Step 4 – Determine Text Column Needs
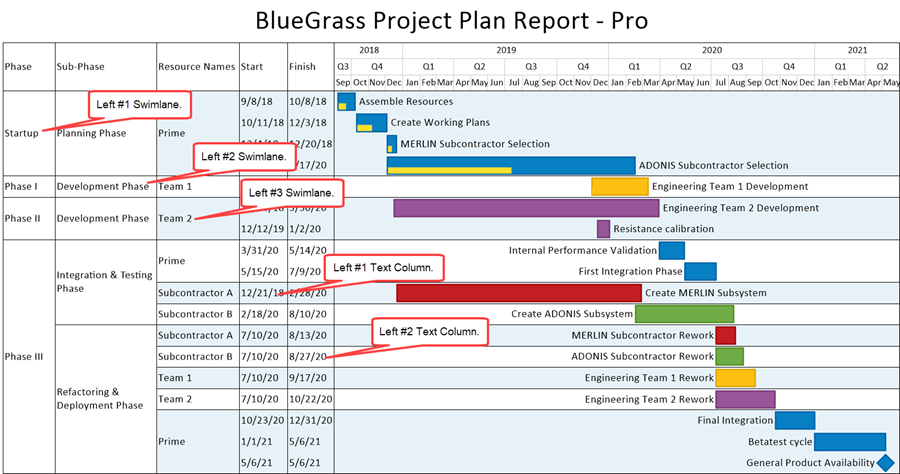
There are five (5) optional Text Columns that you can place to the right of any shown swimlane levels and to the left of the graph. Their purpose is to highlight information pertinent to rows in the graph and the task bars and/or milestone symbols in the chart's rows. A typical example for the content of two text columns is to show task bar start date and finish date as illustrated in the partial chart below:
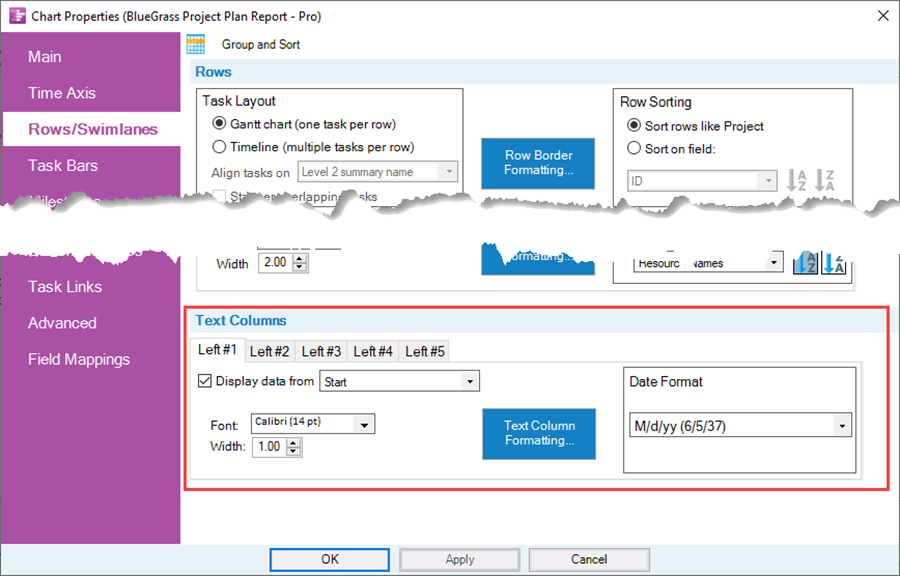
The controls for managing text columns are found in the Template Properties and Chart Properties form's Rows/Swimlanes tab at the Text Columns control group shown here:
Text Columns Sub-Tabs
Each sub-tab shown above as Left#1, Left#2, Left#3, Left#4, and Left#5 are identical in terms of their controls. Checking the Display data from checkbox ON in the sub-tab enables the text column and the other controls in the sub-tab. Use the window dropdown next to the Display data from checkbox to implement your text column decisions with respect to the source plan data for the task bar or milestone symbol that are displayed.
For more information on text columns, please see the article at: Editing Text Columns or Swimlane Labels
Text Column Formatting...
You can now use the Text Column Formatting... button to access the Text Column Formatting - Left#n form to make settings pertaining to text column heading cell labeling and text column cell labeling settings as shown below:
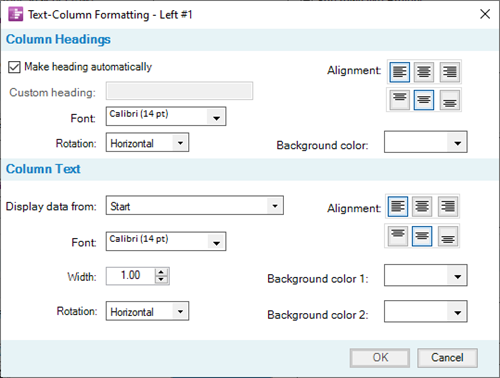
Note in the illustration above that the form's title includes the text column number. The Column Heading control group in the above form contains all the controls for OnePager to set the text column heading cell's label or for you to select the text content for this location in the chart. Additionally, all the text formatting controls are provided in this sub-group. The Column Text control group shown above in the bottom section of the form contains all the controls for setting the text columns cell's labels within the text column. As with the Column Heading control group, the Column Text control group contains all the text formatting controls for the text content of text column cells for level n in the chart.
There are no border controls in this form as text columns are considered part of a chart's row and the controls for row borders are contained in the Rows control group of the Chart Properties form's Rows/Swimlanes tab.
For more information on formatting text columns, please see these articles at:
| Snapshot-Dependent Text Columns for OnePager Pro | Snapshot-Dependent Text Columns for OnePager Express |
| Resizing the Width of Text Columns and Swimlanes |
Text Type Formatting for Date and Numeric Formats
When a text column's designated source plan field is a date type field, the Text Columns sub-group in the main form has an additional sub-group added for you to edit the date field as it appears in the text column cells. This is shown in the illustration below:

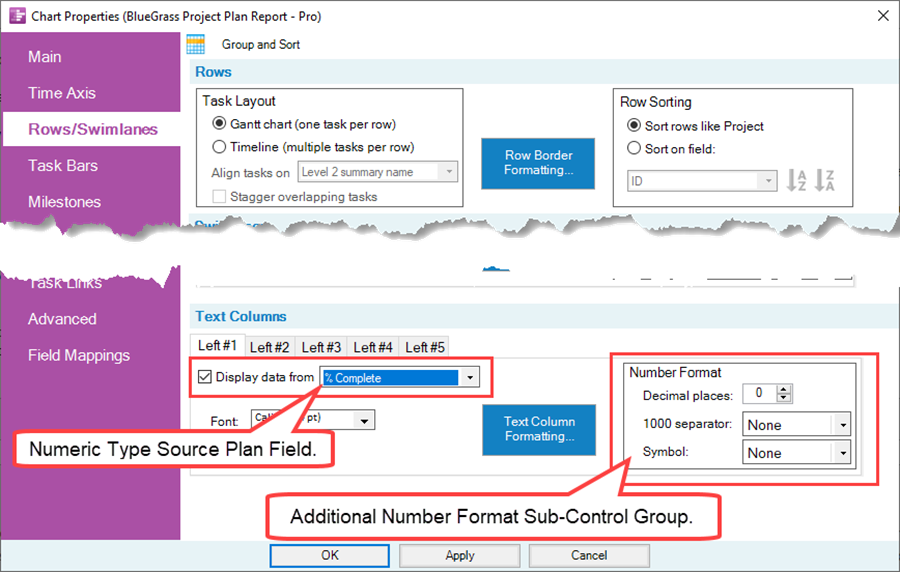
When a text column's designated source plan field is a numeric type field, the Text Columns sub-group in the main form has an additional sub-group added for you to edit the numeric field as it appears in the text column cells. This is shown in the illustration below:
Step 5 – Formatting Row and Swimlane Level Borders
As the final step in preparing your schedule discussion presentation chart with rows and swimlane levels is to choose row and swimlane borders.
Formatting Row Borders
To format row borders click the Row Borders Formatting... button in the Rows control group of the Chart Properties form's Rows/Swimlanes tab to acccess the Row borders form again shown here:

To show all row borders including the borders in text columns, check the Show Row Borders checkbox ON. This enables all the controls in the form. These controls include using the OnePager standard Color Chooser form to select the color for the row borders, the width control for the thickness of the row borders, and the Dash-type which has five (5) options. These controls apply to both the top and bottom row borders. Be aware that row borders may be shared with swimlane level borders whose controls are discussed shortly.
Formatting Swimlane Level Borders
Swimlane border controls are provided for each swimlane level showing in the chart up to three (3). This means that there are three (3) Swimlane Formatting... forms available, one for each possible swimlane level shown. When the Swimlane Formatting... button is clicked, the associated Swimlane Formatting... form is accessed as shown below:

To show a swimlane level's borders, check the Show Borders checkbox ON. This enables all the controls in the form. These controls include using the OnePager standard Color Chooser form to select the color for the swimlane level borders, the width control for the thickness of the swimlane level borders, and the Dash-type which has five (5) options. These controls apply to both the top and bottom swimlane level borders. Caution: Be aware that swimlane level borders may be shared with other swimlane level borders and with row borders as mentioned above.
For more information on managing swimlane level borders, please see the article at: Row and Swimlane Borders
Other Borders in the Chart
The Inner Frame border and the Outer Frame border of the chart are managed by the controls in the Template Properties and Chart Properties form's Main tab's Borders, frames, and time cursor properties button which accesses the Set line properties form shown here:

For more information on managing Inner and Outer chart borders, please see the article at: Main Tab
Related Links
Creating and Editing Rows and Swimlanes (Portal)
About OnePager's Rows and Swimlanes
Collecting Tasks/Milestones into Rows
Editing Text Columns or Swimlane Labels
Snapshot-Dependent Text Columns for OnePager Pro
Snapshot-Dependent Text Columns for OnePager Express
Resizing the Width of Text Columns and Swimlanes
(4.0.1.5-70)