Creating and Editing Rows and Swimlanes for Version 7.1 (Portal)
Contents
Introduction to Creating and Editing Rows and Swimlanes in OnePager
This article series describes OnePager’s Creating and Editing for Rows and Swimlanes features. Illustrations used in this article are from OnePager Pro using data from Microsoft Project but the feature's function, controls, and manual edits apply equally to other OnePager editions that import from data sources like Microsoft Excel, Smartsheet, and Oracle Primavera P6.
About Creating and Editing Rows and Swimlanes
Rows and swimlanes are a feature of OnePager that help you to group, collect, and sort project tasks and milestones dynamically based on your underlying project data. These articles cover how to create rows and swimlanes in your charts and perform manual edits on the properties of rows and swimlanes. The articles in this series provide overview and detailed instructions on how to use the new OnePager Multiple Swimlanes Levels Feature.
Most row and swimlane editing is done globally, so you should also read the Editing with the Chart Properties form (Portal) articles to familiarize yourself with some of the more common row and swimlane features.
Manual editing of row and swimlane properties is done in the Chart Editor using the capabilities documented in the link sub-section.
Creating a Chart with Rows and Swimlanes
All editions of OnePager are distributed with a number of Templates Properties forms that can be used to create various chart looks. Many of these Templates Properties forms already have swimlanes defined.
See the article at: Managing Templates (Portal) for more information.
Our recommendation for first time users of OnePager is to create your first chart with the format specified by the current Template Properties form. Once the chart is created, you have the capability to make edits including designating which source plan column/field should be used to control the creation of rows and swimlanes. For the purpose of this article series, we assume that you have created a chart without any visible rows or swimlanes and that you desire to organize your chart into swimlanes and provide at least one text column per row in the chart to display source plan information.
Please review the Getting Started article series which cover all source plan types at: Getting Started (Portal) to see the creation of a chart with a swimlane.
For a quick overview of OnePager's rows and swimlanes feature, please see the article at: Using Rows and Swimlanes
Links to Detailed Articles on Creating and Editing Rows and Swimlanes
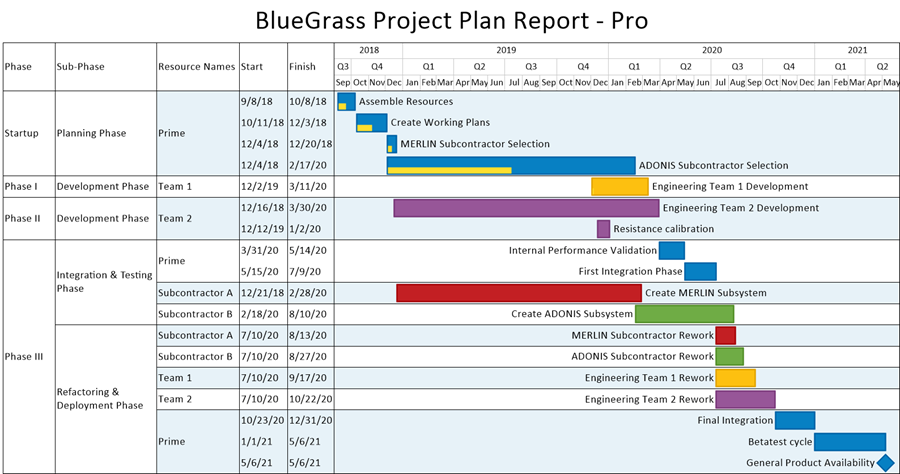
Add editions of OnePager support the multiple swimlane levels feature. A Gantt chart with multiple swimlane levels and multiple text columns is shown here:

In the illustration above, the first three columns in the chart are the three multiple swimlane levels and the two columns to their right are two text columns. Timeline layout charts where multiple source plan tasks are placed in a single chart row can also have multiple swimlane levels and text columns. A description of this new feature and an overview of its operations and controls are provided in the first two articles at the links below. Our recommendation for new OnePager users is that you read the two articles in the table of links below to become familiar with the multiple swimlane levels concepts and the forms and controls available before using multiple swimlane levels to construct new charts. Experienced OnePager users are advised to review the first article and familiarize yourselves with the new organization and layout of the enhanced forms and controls contained in the second article below:
Overview and Summary Articles
The articles listed in the tables below describe OnePager’s Multiple Swimlane Level feature. Illustrations used in this article are from OnePager Pro using data from Microsoft Project but the feature's function, controls, and manual edits apply equally to other OnePager editions that import from data sources like Microsoft Excel, Smartsheet, and Oracle Primavera P6.
| About OnePager's Rows and Swimlanes |
| Using the Multiple Swimlane Levels Feature - Overview |
The articles in the tables of links below provide detailed information on creating and editing rows and multiple swimlane levels for OnePager:
Creating, Formatting, and Editing Rows and Swimlanes with the Chart Properties Form
Manual Editing of Rows and Swimlanes in the Chart Editor
| Resizing the Width of Text Columns and Swimlanes |
| Moving Rows |
| Moving Swimlanes |
| Resizing the Height of Rows |
| Resizing the Height of Swimlanes |
| Manually Hiding and Unhiding Swimlane Levels |
Editing Rows and Swimlanes Using Right-Click Context Menu Commands
Zebra Striping Rows and Swimlanes
| Zebra Striping for Rows and Swimlanes for OnePager |
Related Links
Editing with the Chart Properties form (Portal)
(12.0.1-71)
- Version 7.1
- Charts
- Template Properties Form
- Chart Properties Form
- Ribbon
- Editing a Chart
- OnePager - Tool Bar
- Task/Milestone Editing
- Rows and Swimlanes
- Multiple Swimlane Levels
- Labels
- Text Columns
- Snapshots
- Snapshot Dependent/Independent
- Row Stripes
- Swimlane Stripes
- Mavericks
- OnePager Pro
- OnePager Express
- OnePager Bundle