Getting Started with OnePager Pro Version 7.0 Add-in
Contents
- 1 Overview
- 2 Launching OnePager Pro for the First Time
- 3 Creating a New Chart
- 4 Opening a Chart
- 5 Replacing A Snapshot - Updating a Chart with Changes Made to the Microsoft Project Source Plan's Data
- 6 Adding a Snapshot - Adding to the Chart with Changes Made to the Microsoft Project Source Plan's Data
- 7 Editing the Chart
- 8 Enhanced Capabilities Provided in OnePager Pro Version 7.0
- 9 Related Links
Overview
As with previous version of OnePager Pro, version 7.0 of OPP you can launch OPP from a Desktop Icon as well as from within Microsoft Project (Add-in). Please note that after selecting the Add-in launch option that you are not be able to launch the OnePager Desktop application.
Only one of these applications (Add-in or Desktop) can be launched at a time. If you attempt to launch both, a warning message appears as shown below:
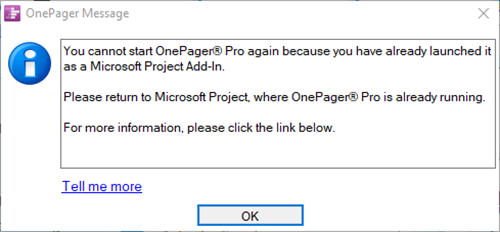
If you need further information, please consult this link: OnePager Doesn't Launch when the Desktop Icon is Clicked.
This article provides the basic information needed to Getting Started and use OnePager Pro (OPP) after you launch OPP from Microsoft Project. The article providing Getting Started guidance when launching from the OPP Desktop Icon is at: Getting Started with OnePager Pro Desktop
Launching OnePager Pro for the First Time
The OPP Add-in automatically displays the OnePager Icon on the Microsoft Project Add-in ribbon tool bar tab once OnePager is installed. That OPP Add-in ribbon tool bar button set looks like this:
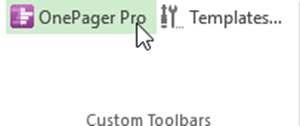
Clicking the OnePager Pro button launches the Chart Editor. Clicking the Templates… button lets you edit the Template Properties form provided with the product. For now, it is simplest to use the default Template Properties form.
You can learn how Template Properties forms let you customize and standardize graph features later at: Managing Templates (Portal)
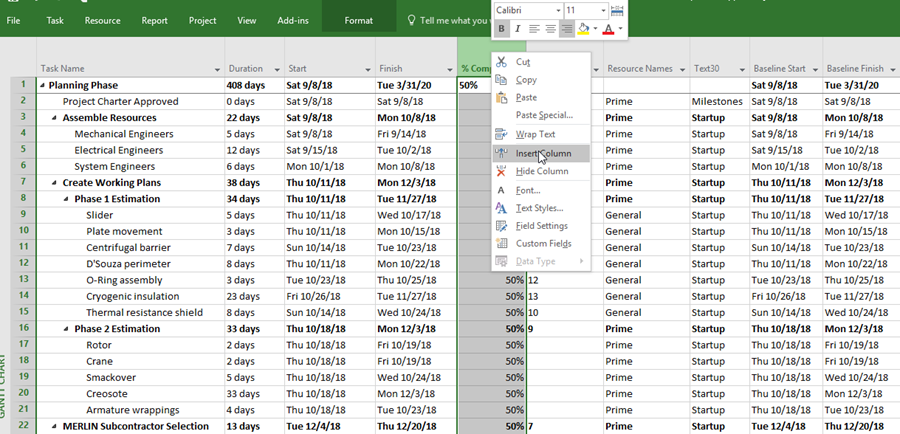
To control which tasks are imported, specify the Microsoft Project Flag field (e.g. Flag1, Flag2 … Flag20) that you wish to use. Number fields can also be used the same as the Flag fields where a 1 in a Number field indicates Yes and a 0 in a Number field indicates No. Un-hide that field in Microsoft Project by right-clicking in the field header area and selecting Insert Column:
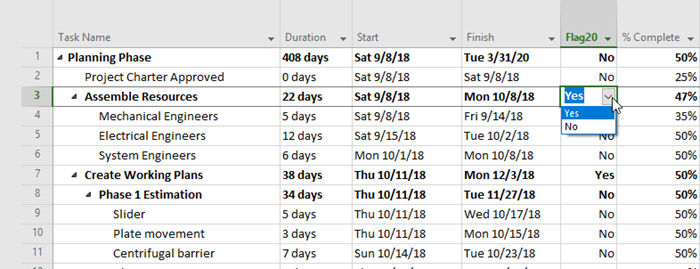
Now put a Yes in this Flag field for any task that you want to graph:
When making your first chart, we strongly recommend that you select 50 or fewer tasks with Yes. Please note that OPP is shipped with a number of fully populated Template Properties forms that are based on the Microsoft Project source plan used in the OnePager Tutorial shipped with the product – BlueGrass Project Plan. Note that three field heading types must always be present: Name, Start, and Finish. Caution. Starting in Microsoft Project 2010, there is a Manual Scheduling mode that allows you to leave dates blank in your schedule. However, behind the scenes, these dates are still being automatically assigned to the project Start Date, or to Today's Date if the project Start Date is not defined. Even though the dates appear to be undefined, they are defined behind the scenes, and are being passed to OPP. Because Today's Date often equals your Snapshot date, it is not surprising to see all of these dateless tasks appearing near the time cursor. Solutions. There are two solutions available:
- 1) Define the dates for your tasks and milestones in Microsoft Project. This overwrites any default dates that Microsoft Project is assigning, and makes your project schedule more consistent with your OPP timeline. As a rule of thumb, we recommend defining dates for all tasks and milestones in your source plan, especially when it comes to creating a OPP chart.
- 2) Or, remove the dateless tasks from your OPP graph. You can leave them in your Microsoft Project source plan, but by removing them from the OPP graph, you won't have to explain why certain task bars and milestone symbols are appearing in weird places when they really should not.
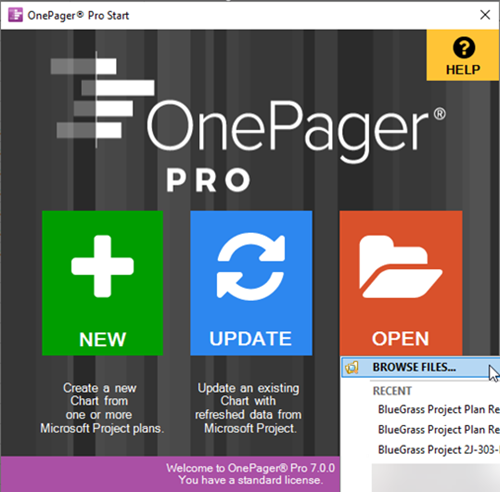
To launch OPP and make a chart, click the OPP button on the Microsoft Project ribbon tool bar’s Add-ins tab, which accesses the OnePager Pro Start form:
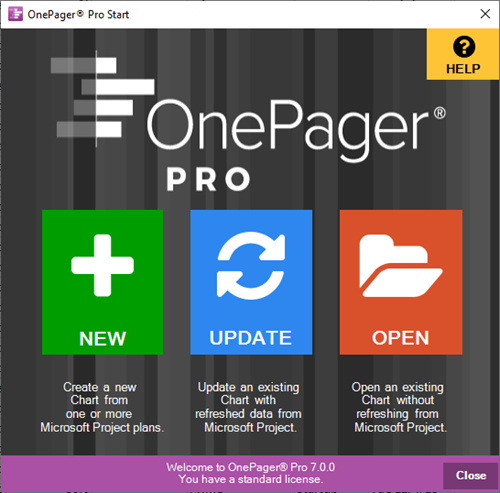
The OnePager Pro Start form provides you with three options:
- 1) NEW Clicking the NEW button accesses the OnePager Pro choices (OPC) form.
- 2) UPDATE Clicking the UPDATE button allows you to BROWSE FILES for an existing chart or select a recently-opened chart.
- 3) OPEN Clicking the OPEN button allows you to BROWSE FILES for an existing chart or select a recently-opened chart.
Once selected and opened, the chart is available for editing.
Creating a New Chart
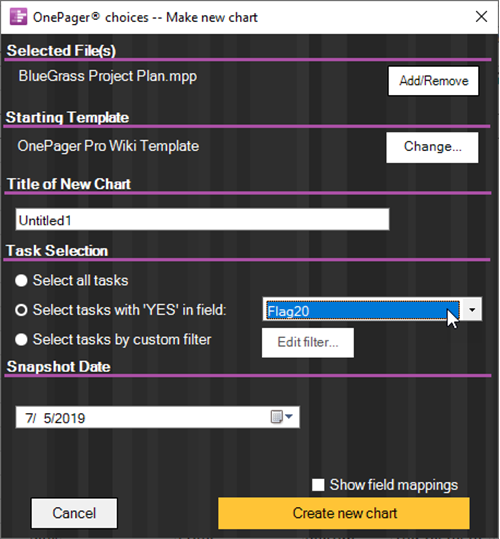
Clicking the NEW button accesses the OnePager choices (OPC) form as shown below:
Options on the New OnePager Choices form
The OPC form gives you more options for selecting source plans. The illustration above shows that OPP is initiated from Microsoft Project with the source plan shown in the Selected File(s) group shown above. The Add/Remove button gives you the capability to add more source plans to the source packet or, for multiple file packets, to remove files. Clicking the Add/Remove button accesses the Data source selection form as shown below:
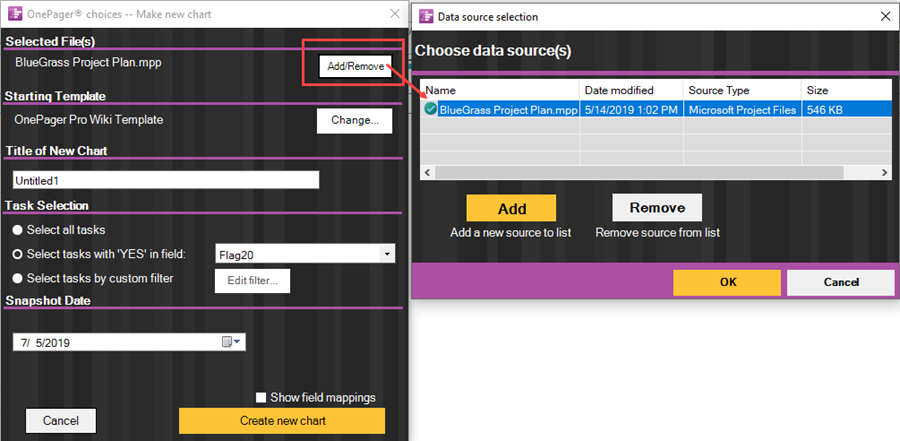
The Data source selection form displays the current source plan that was loaded with Microsoft Project when you clicked the OnePager Pro button. This form lets you Add more Microsoft Project source plan to create a multi-project chart or Remove a source plan from a multi-file source packet. These options are detailed below.
Adding a New Source Plan
When you click the Add button, OPP gives you the option to bring up a Windows Open form when you select the BROWSE FILES… option as shown here:
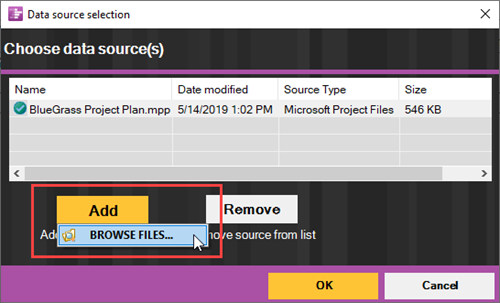
Clicking the BROWSE FILES… option displays a Window’s Open form so you can select a Microsoft Project source plan to add to the source packet. A sample Open form is shown below:
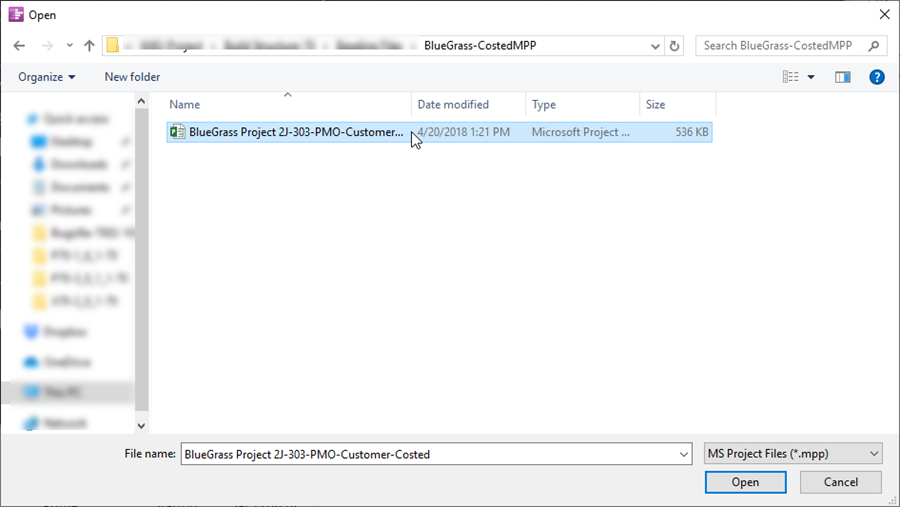
When you select a desired Microsoft Project source plan and click the Open button as shown above, OPP adds the source plan to the source packet and displays it in the Data source selection window as shown below:
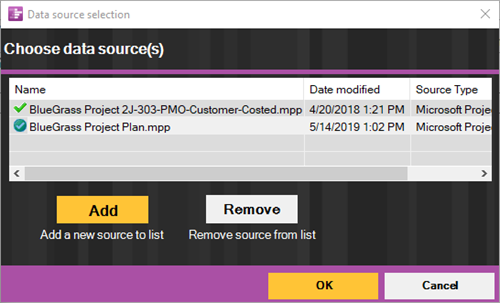
The selected source plan is added to the source packet as shown above. OPP shows the path name of the source plan in the window if you hover the mouse over the source plan name. If you select a recently used source plan from the dropdown menu displayed when the Add button is clicked (Data source selection form), OPP adds that source plan to the source packet.
Removing a Source Plan
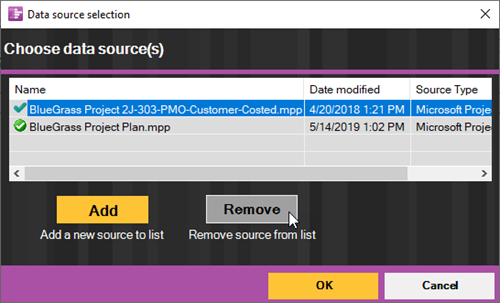
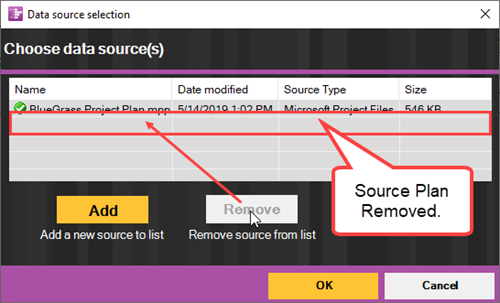
The Remove button allows you to remove a source plan from a source packet if that source plan is not needed to create the new chart. To remove a source plan, first select the source plan in the Data source selection form’s window so that it is highlighted in blue then click the Remove button as shown in the sequence below:
Other Choices to Make
Moving on to the other groups of the OPC form, you are asked to confirm a few things before you build the chart. OPP makes good guesses for each of these choices, but you can change any of them:
Starting Template
The current Template Properties form determines which fields are imported from Microsoft Project and how the initial chart looks. OPP ships with many sample Templates Properties forms, but you can also customize your own Template Properties form. To choose which Template Properties form to use in building your chart, click the Change… button in the top group of the OPC form as shown here:
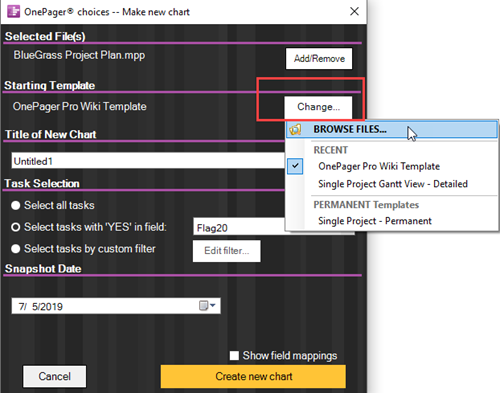
For now, just stick with the default Template Properties form entitled Single Project Gantt View – Detailed, but you can always use a different Template Properties form to get a different type of chart.
Title of the New Chart
This is the Title of the chart and also the suggested save name. You can change the save name when you save it. We recommend that you enter a Title that helps you identify the chart later on as shown here:
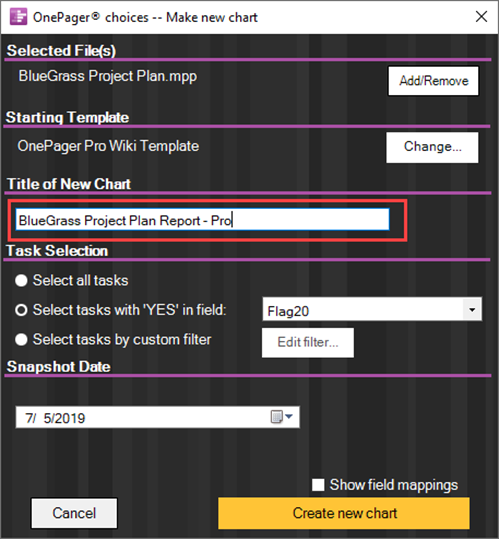
For each chart you create, OnePager remembers colors, titles, legends, font sizes, and all other graph properties so that your work is saved. Later, you can update the chart with a snapshot of how the project looks on a different date. Then you can browse through the snapshots to see how the project is changing over time. OPP also saves the path name associated with the save name (.TAM). Path names are not available in .TAMs produced with versions of OPP prior to version 6.0.
Task Selection
This is how you tell OPP which tasks to import from your Microsoft Project source plan as indicated below:
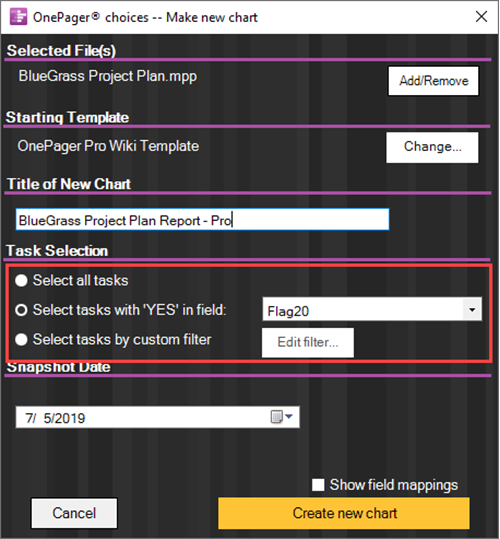
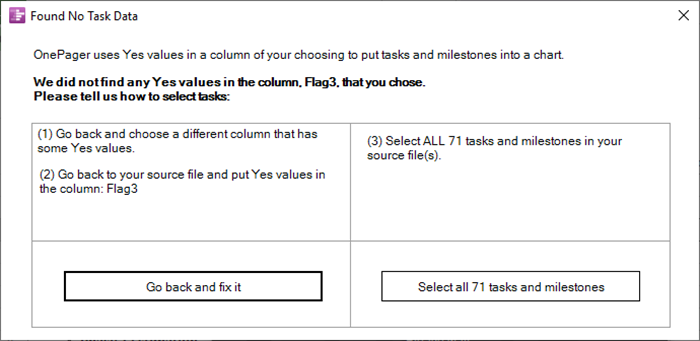
Either click the Select all tasks radio button to create a chart with everything or choose a Flag field. You can make several charts from a single Microsoft Project source plan, each using a different Flag or Number field. In OPP, if no Flags are set to Yes, OPP provides you with a warning message shown below:
Clicking the Select tasks by custom filter button enables the Edit filters... button. Clicking the Edit filters... button takes you to a form that controls the Conditional Import Filters feature as shown here.
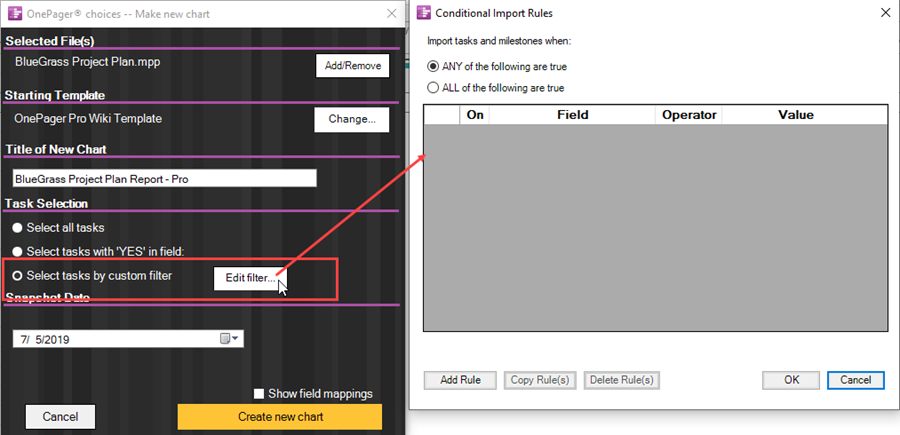
For more detailed information, please see the article at: Conditional Import Filters (Portal)
Snapshot Date
This is the date of the chart and lets you keep track of how schedules change over time. The snapshot date is set by default from your Microsoft Project source plan's Project Information tab's Current date. You can change the snapshot date by clicking on the dropdown button at the window shown in the illustration below:
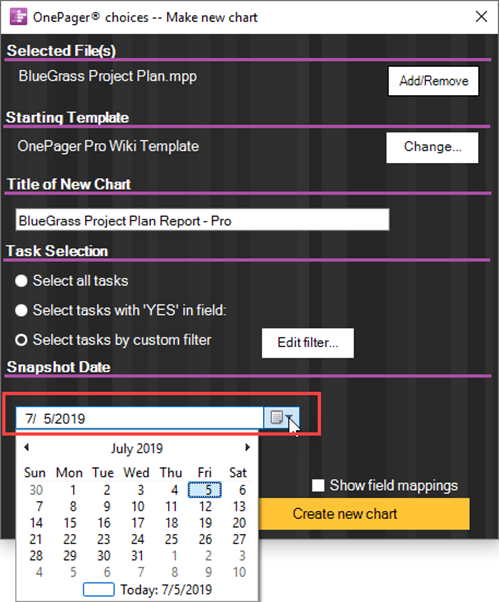
Making a calendar date selection as shown above establishes the snapshot date for the chart and the snapshot being created. Each chart can have many snapshots. Snapshots and their management are important topics. Snapshots are the basis of how OnePager Pro helps you track the progress of your project.
For more information, please see the articles at: Managing Chart Data (Portal)
Show Field Mappings
The Show field mappings checkbox is near the bottom of the form. When this box is checked ON you have a chance to review and change the Microsoft Project field mappings to OPP before you make your first chart. To do this, click the Next> button as shown here:
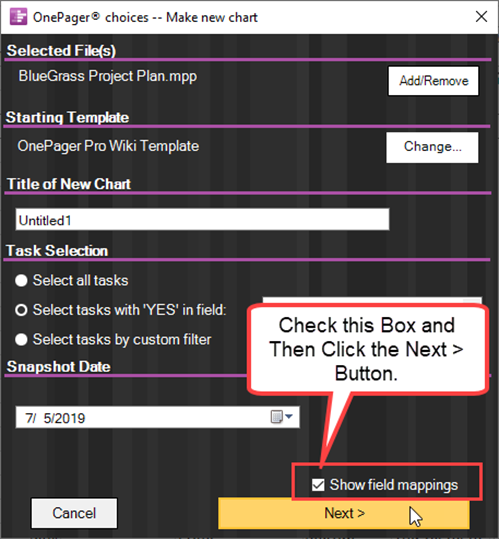
You now see the following form:
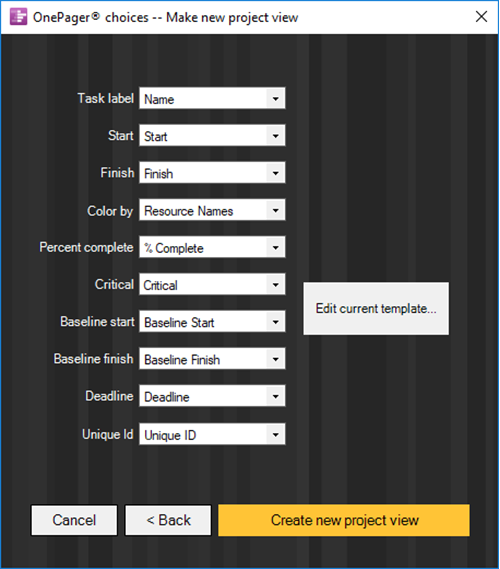
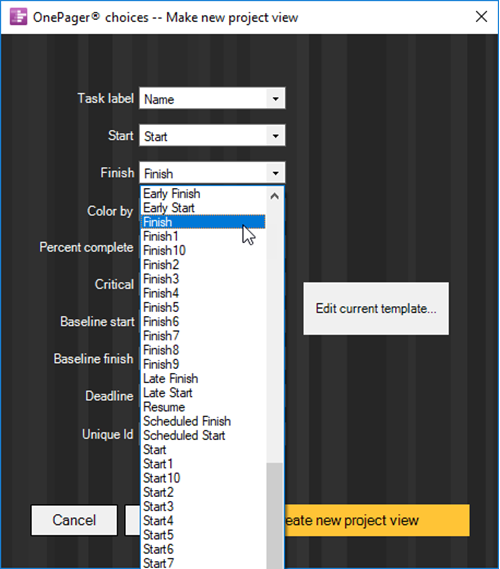
Notice in the above form that OPP has relied on the current Template Properties form to make some guesses on which Microsoft Project source plan fields should be used in making the chart. You can easily change any of these field mappings by making selections from the dropdown menus. For example, shown below is how to change which Finish Date in Microsoft Project is used to create the chart's Finish Date:
Making the Graph
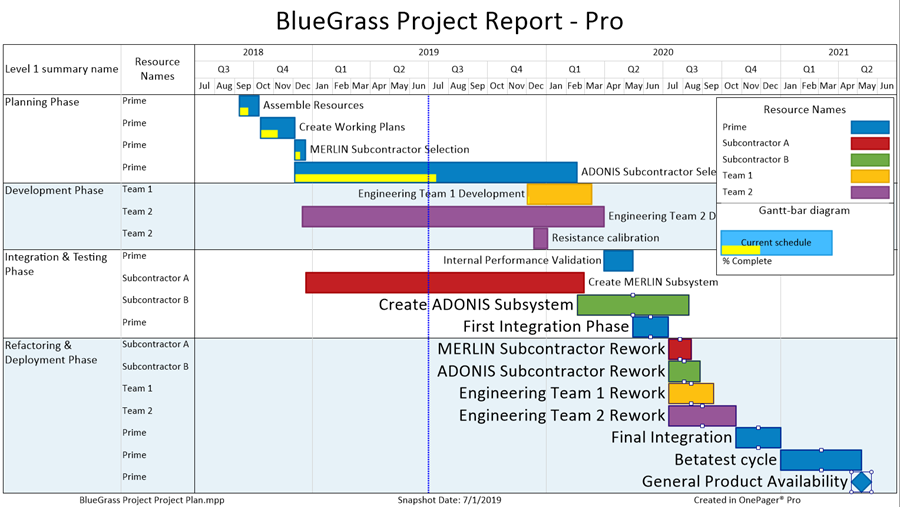
Once you are satisfied with the field mappings, click the Create new chart button to import the desired Microsoft Project source plan data and create a OnePager Pro chart. After a second or two you see the Chart Editor form that looks like this:
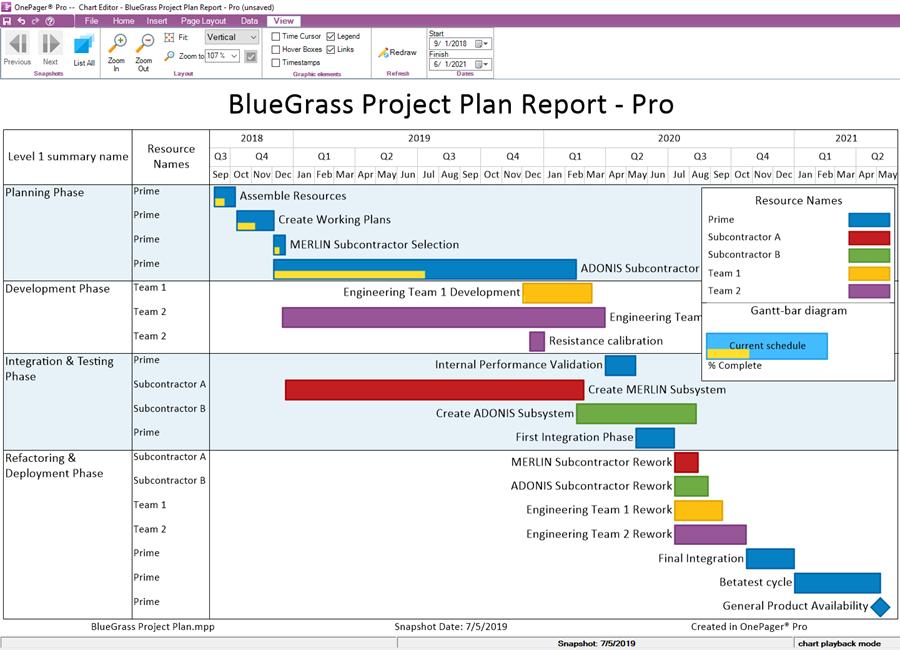
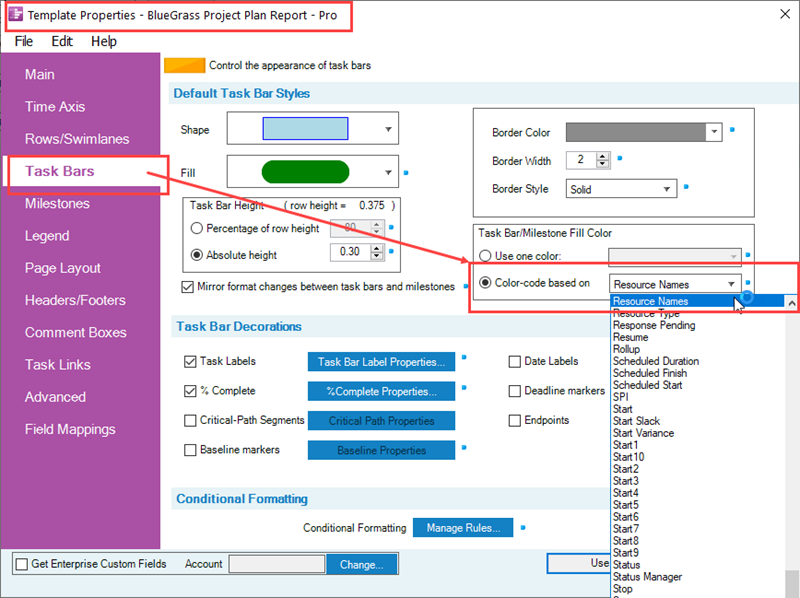
Note that each task bar or milestone symbol is color coded based on the value in the Resource Names field. The Legend contains an optional diagram near the bottom explaining that the bars inside the task bars represent percent complete extracted from Microsoft Project. Percent complete comes from a Microsoft Project field that you specified in the field mappings form. Note that the current Template Properties form is the Template use by OnePager Pro to create the first chart and determines how your data looks in the new chart. The Template Properties form's Task Bars tab shows where the color control is located is shown below:
Copying the Chart to Microsoft PowerPoint
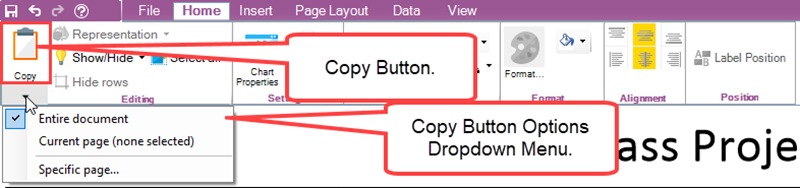
OnePager provides access to the Windows clipboard so you can copy the chart and paste it into another application. To copy the current chart snapshot to the clipboard click the Copy button on the Home ribbon tool bar tab as shown below:
Then launch Microsoft PowerPoint and paste the clipboard copy of the chart into a Microsoft PowerPoint slide, as shown below:
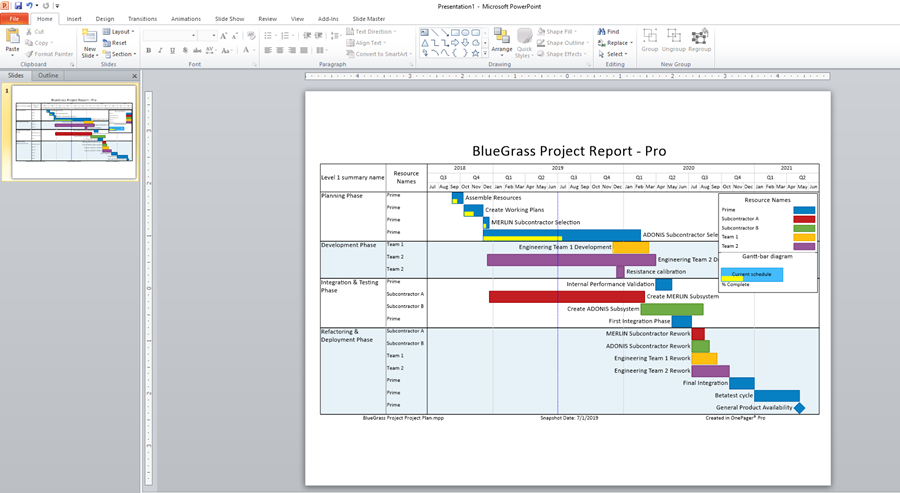
That’s it! You’ve created a professional 1-page schedule summary from a complex Microsoft Project schedule and copied it into a Microsoft PowerPoint presentation. You can also print the chart by selecting the Print button on the File tab. OnePager has other features that let you move task bars vertically to different rows and swimlanes, change the number and levels of swimlanes, add swimlane titles, show graphic dependencies among tasks, change task bar colors, hide task bars, edit text items, add floating comment boxes, add comment boxes to task bars, and standardize on chart styles across organizations.
To learn more about these features, read about the specific workflows in this Wiki at: Basic Workflows (Portal)
Opening a Chart
The right-most button on the OPC form is the OPEN button. Clicking the OPEN button displays a dropdown menu which is the same for the UPDATE button. The options in the dropdown are discussed below:
Clicking the BROWSE FILES... option accesses a Windows Open form from which you can select a .TAM that you want to open. Selecting the desired .TAM causes OPP to display the selected chart in the Chart Editor. From the Chart Editor, you can edit the chart, save it, or share it with others. Clicking any of the RECENT charts items in the dropdown menu above causes OPP to load the associated .TAM into the Chart Editor.
Replacing A Snapshot - Updating a Chart with Changes Made to the Microsoft Project Source Plan's Data
Suppose, after examining the chart you created and saved, you realize that it might be best to show more task bars. This, you think, would greatly improve your schedule presentation. Updating the chart at this point is simple. Recall that OPP is active and the Chart Editor is displaying the current chart you want to update. Additionally, the Microsoft Project source plan and the application are active. The original chart looked like this:
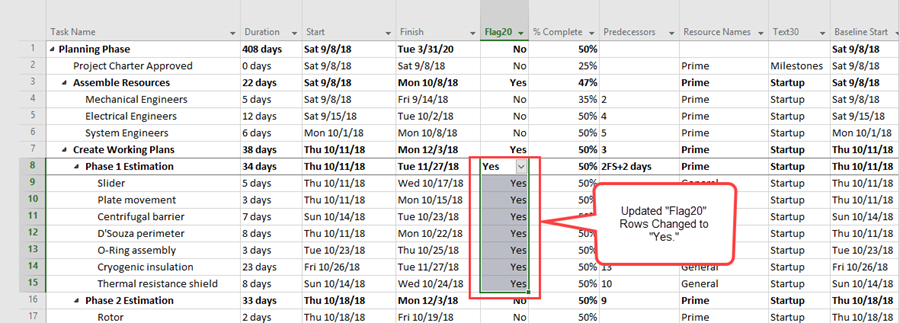
Since Microsoft Project is still an active program and the Microsoft Project source plan you are using is still being displayed, go back to the Microsoft Project application and change the Flag20 field setting from No to Yes for the tasks you want to now import and display. A section of the Microsoft Project source plan where this is done is shown below:
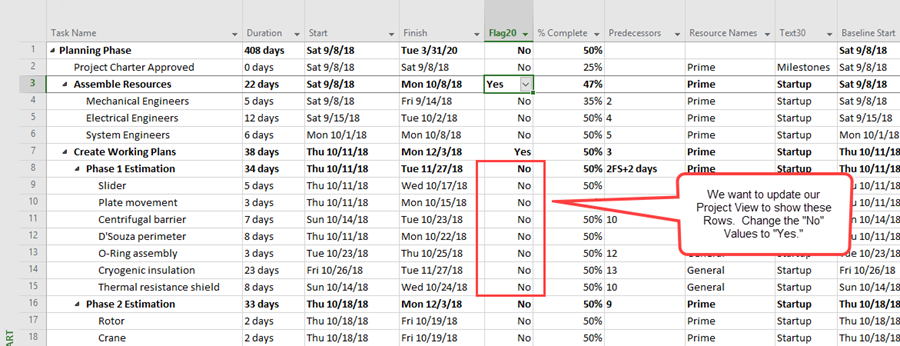
Once you’ve made the Flag20 changes lines 8 through 15 in the Microsoft Project the source plan looks like this:
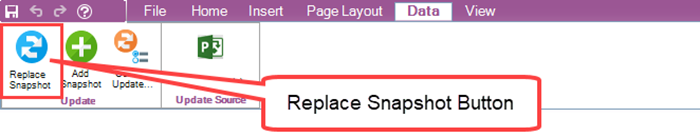
With the Microsoft Project source plan updated, go back to OPP and navigate to the Data ribbon tool bar tab where you see several buttons. To update your chart to show the additional task bars from your Microsoft Project source plan, click the Replace Snapshot button as shown below:
When you click the Replace Snapshot button, OPP goes back to the Microsoft Project source plan that you just changed, imports all the tasks that changed, and updates your chart. At the conclusion of the operation, the updated chart looks like this:
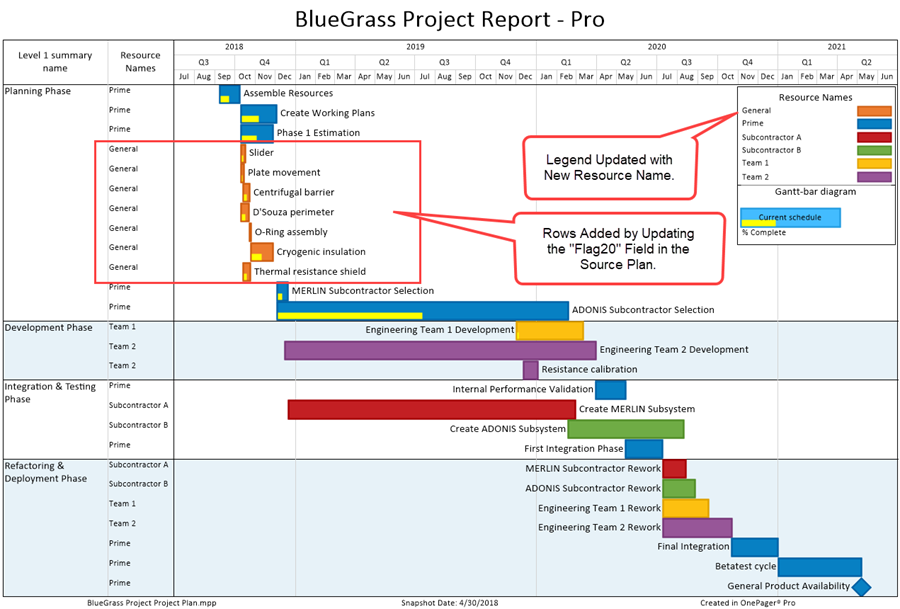
The example above is just one of many uses of the Data ribbon tool bar tab’s Replace Snapshot button when you need to update a chart. You can do this as many times as necessary until the chart is the way you need it. In addition to adding and removing tasks by changing the Microsoft Project Flag20 field, you can change source plan task Start Dates, Finish Dates, or Percent Complete and display these data changes in the chart. Using the procedure above you can do this very efficiently. You can now save the chart by giving it a save name. When you save the chart in OPP, OnePager saves the .TAM and saves the Microsoft Project source plan name and path information. This is useful when you want to further update the chart or when you want to add a snapshot later on. In the examples below we assume that the chart is saved as BlueGrass Project Report - Pro.
Adding a Snapshot - Adding to the Chart with Changes Made to the Microsoft Project Source Plan's Data
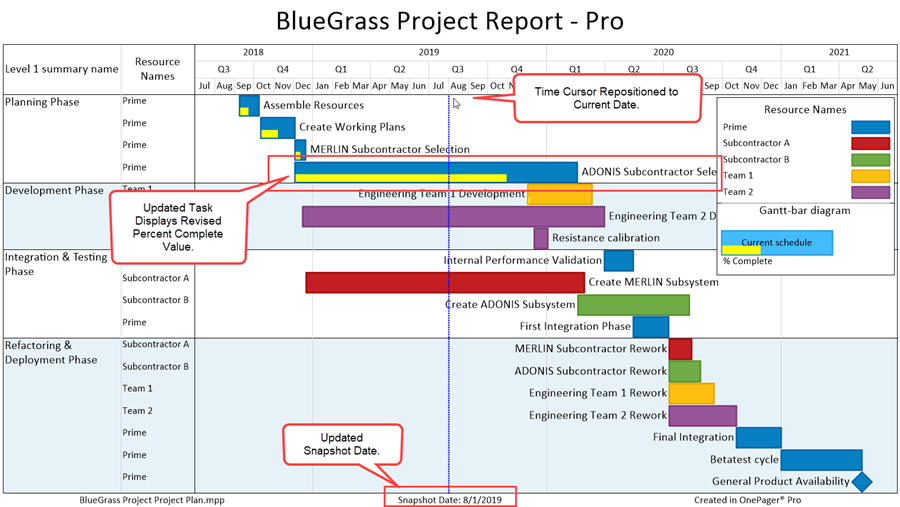
The power of OPP is illustrated when, after a period of progress on the project, it is time to produce another chart. OnePager produces your next snapshot with the same look and feel as the original. ssuming that the Microsoft Project source plan was updated with actual start and finish, percent complete, and other relevant data during the reporting interval, OPP can easily generate a new snapshot. Suppose we have the following chart created on 7/1/2019 and we want to create another graph from the updated Microsoft Project source plan on 8/1/2019.
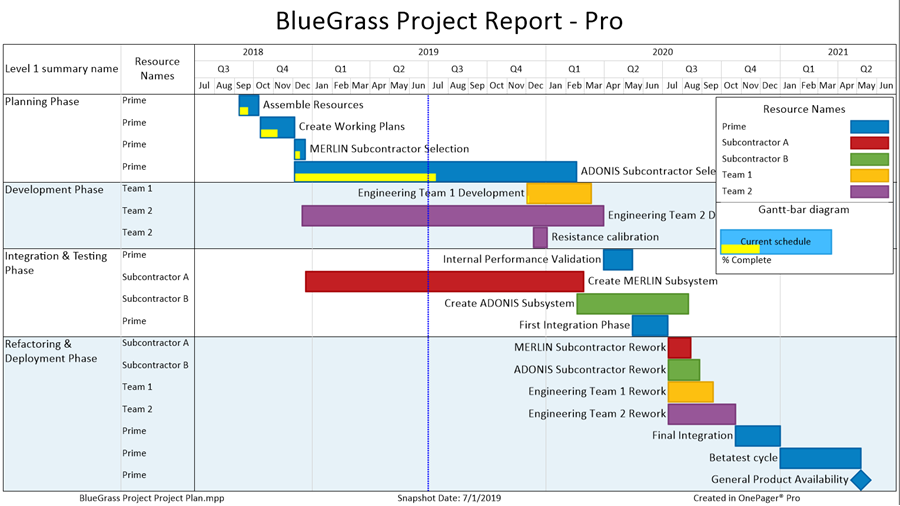
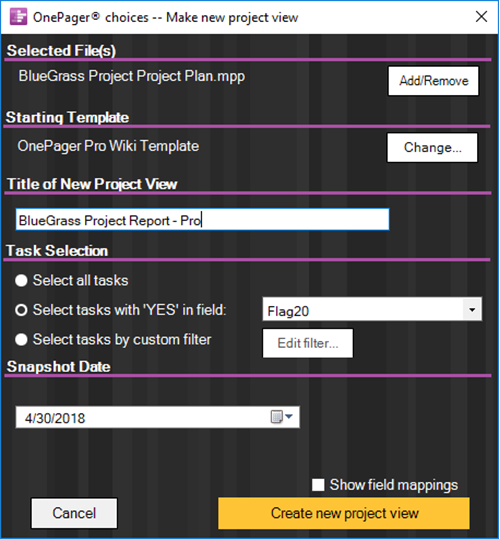
Before creating a new snapshot for 8/1/2019 as planned, we need to update the Microsoft Project source plan say by updating the Percent Complete for the ADONIS Subcontractor Selection task to 75%. When the source plan is updated with this revised information we can proceed. Launch OPP either from Microsoft Project (Add-in) or from the Desktop Icon and click the UPDATE button on the OnePager Pro Start form. Doing so accesses the following OnePager choices (OPC) form shown here:
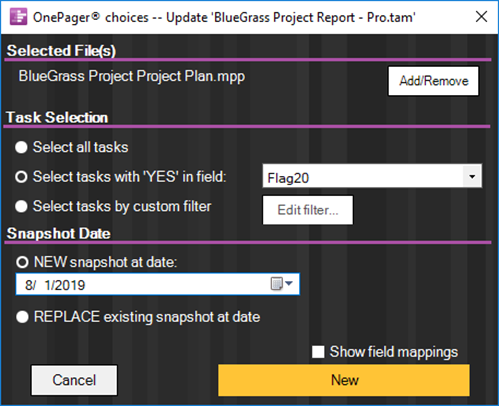
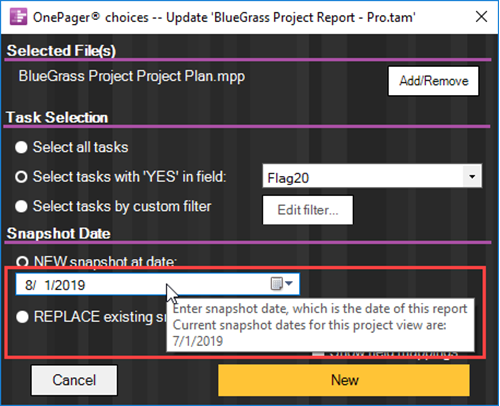
In the OPC form select the NEW snapshot at date: as shown above. You can also select a date for the snapshot so that this snapshot represents the project at the status date point in time. To see which snapshot dates already exist, just position your mouse over the NEW snapshot at date: window to see a list of the existing dates.
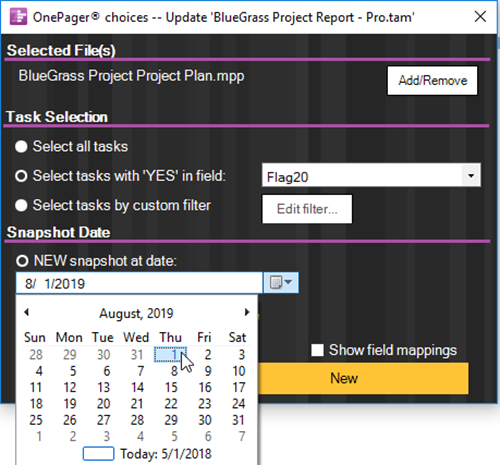
You can use the built in calendar dropdown or type in the new snapshot’s month, day, and year in the window provided as shown below:
Un-check the Show field mappings checkbox OFF if you want to use the same field mappings as you used before. The bottom of the screen now looks like this:
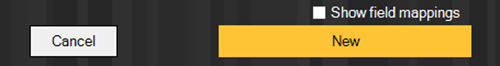
Pressing the large New button creates a new snapshot for the chart. The chart opens at the new snapshot. The color, fonts, title, and swimlane assignments are consistent between the two snapshots:
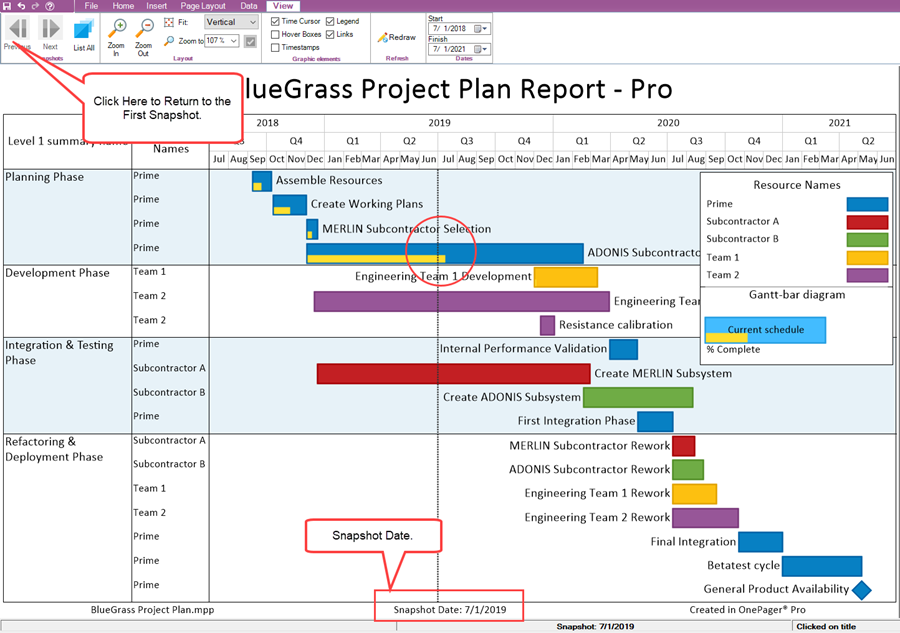
You can go back and forth between the two snapshots by using the snapshot forward/backward buttons on the View ribbon tool bar tab as shown below:
Editing the Chart
Editing Task Bar Name Label Font Sizes
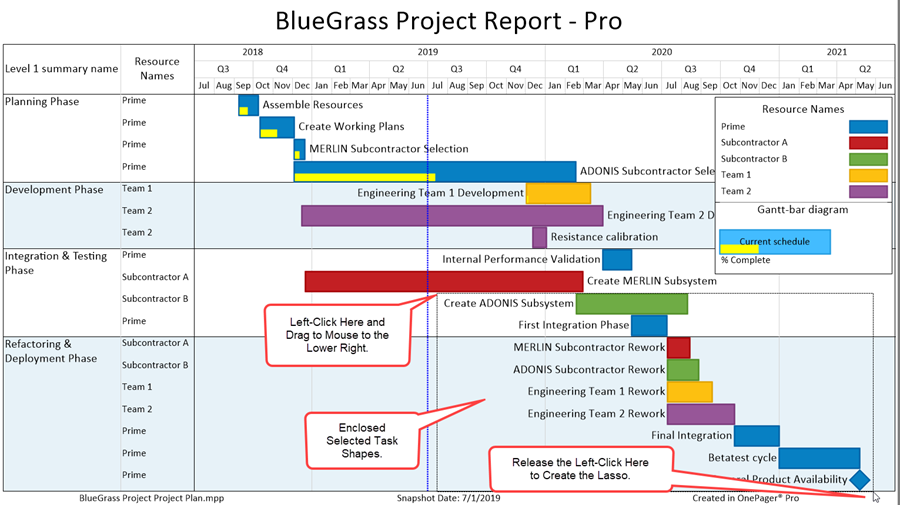
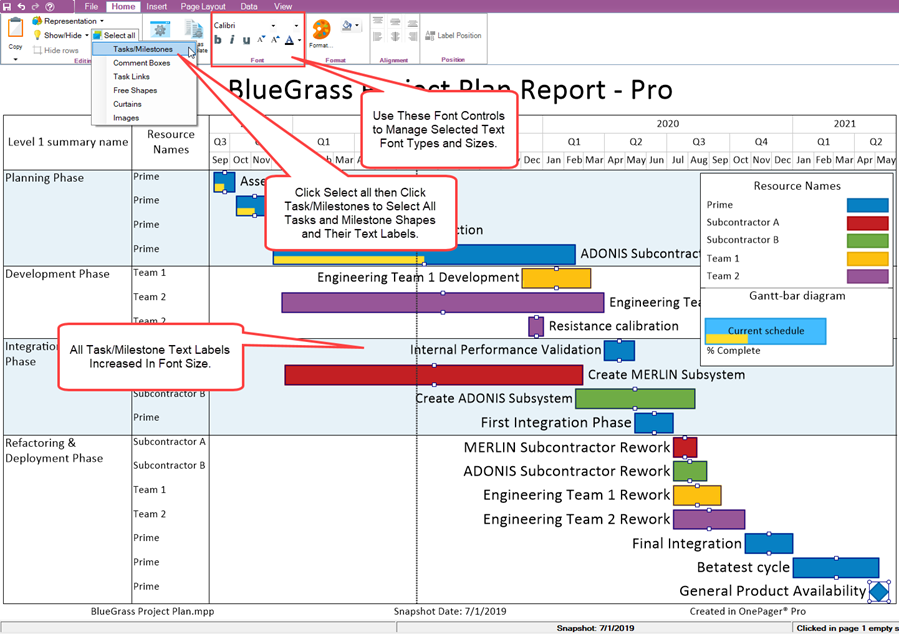
You can always edit the font sizes and label positions on task bars and milestone symbols to optimize readability. To do this, hold down the left mouse button and drag a selection box (Lasso) that encloses many task bars and milestone symbols at once:
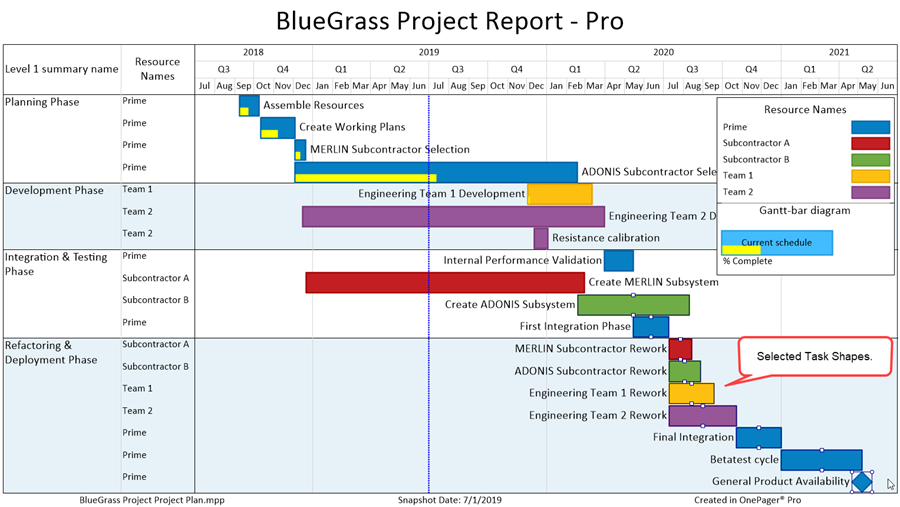
When you release the mouse, the enclosed task bars and milestone symbols are all be selected:
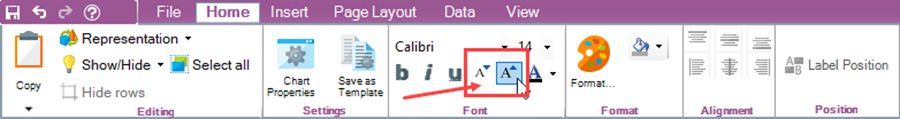
Click the Increase Font Size button on the Home ribbon tool bar tab shown below:
The chart now looks something like this:
Repeating this operation for the remaining task bars and milestone symbols (we could have done Select All and done it all at once!), we obtain a chart with larger fonts on all the task bars and milestone symbols:
Editing Task Bar Name Label Positions
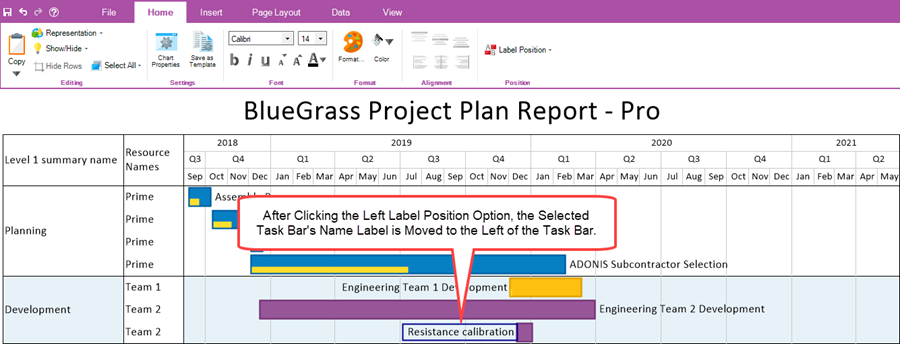
Another common editing action is to move the task bar's name label from their current positions to positions elsewhere around or on the task bar. To do this, click the name label to select it and then click the Label Position button on the Home ribbon tool bar tab. This action accesses the Label Position dropdown list where you can select one of the label positioning buttons as shown here:
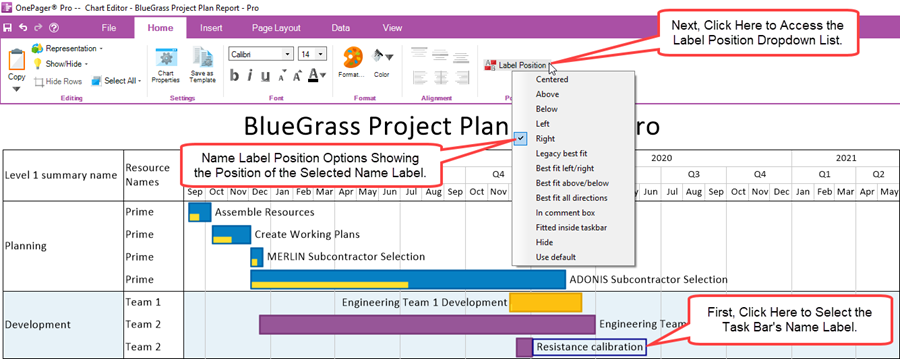
At this point, as an example, click the Left option in the dropdown and the selected name label is moved to the left side of the task bar as shown here:
In case you change your mind about the last editing action you took, you can UNDO the last editing action by clicking the UNDO button above the OnePager ribbon tool bar tabs. Successive clicking the UNDO button undoes editing actions in the reverse order that they were applied.
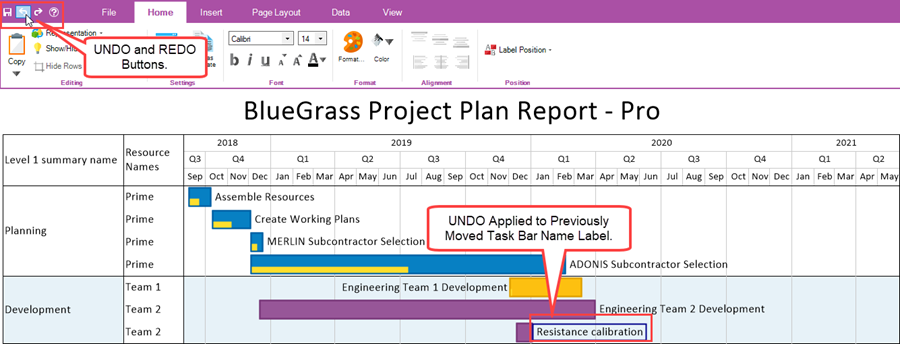
Save the edited chart by pressing the Save button above the ribbon tool bar tab next to the UNDO button. All of the font size changes, text-position edits, and the new Legend position are now saved in case you need to update this chart with new data at a later time.
Editing Other Chart Contents
The examples above are just samples of Chart Editor capabilities provided for editing within the chart. Making other edits to task bars and milestone symbols and name labels are covered in more detail in this article: Manual Editing Task/Milestone Shapes and Text Labels (Portal)
Additionally, you can add task bar and milestone symbol information related to each task and milestone imported such as baseline data, percent complete information, and critical path information. You can add comment boxes to task bars, free floating comment boxes in the chart, vertical curtains, task links to show dependencies, multiple swimlane levels and background images. And you can change the chart's Start/End Dates, add or hide the Legend, and add time axis levels at the top, bottom, and within the graph. Further, you are able to edit task bar and milestone symbol shapes; you have controls for editing rows/swimlanes, headers and footers in the chart, background colors, and other text information shown in the graph.
These capabilities and the articles that provide the detailed information on how to use them can be found at: Ways to Make Changes to Your Chart
Enhanced Capabilities Provided in OnePager Pro Version 7.0
Multiple Swimlane Levels
Previous versions of OnePager Pro and Express supported one level of swimlanes which allowed you to group rows together based on a particular source plan data field and its values. OnePager Pro and Express version 7.0 now supports three swimlane levels which can be nested inside one another to better display a hierarchy relationship for a Program, it’s Projects, and their Phases as shown here:
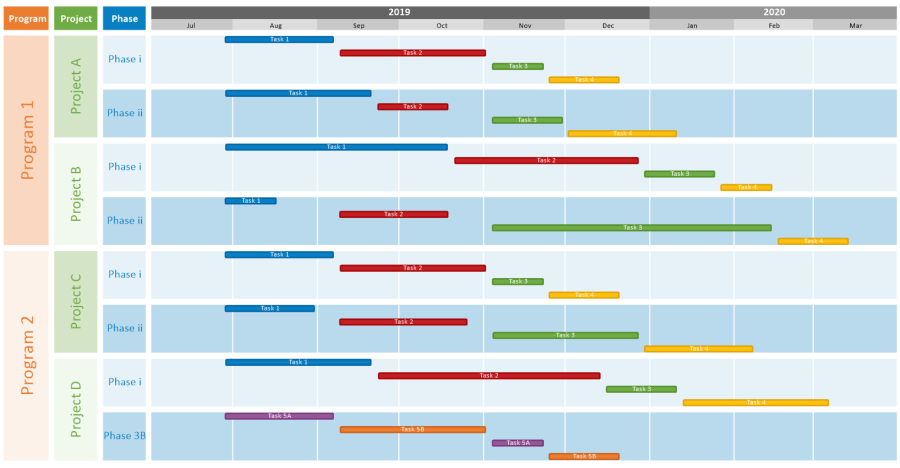
In the illustration above, the first swimlane level is “Program” and under it as the second swimlane level are its “Projects”. The third swimlane level under each “Project” are “Phases” and the rows within each Phase show the task bars at their appropriate start/end dates. Definition and editing of these multiple swimlane levels is accomplished in the Template Properties and Chart Properties form’s Rows/Swimlanes tab that is modified to provide all the controls necessary to manage these multiple swimlane levels in the chart. The Rows/Swimlanes tab of the Chart Properties form is shown below:
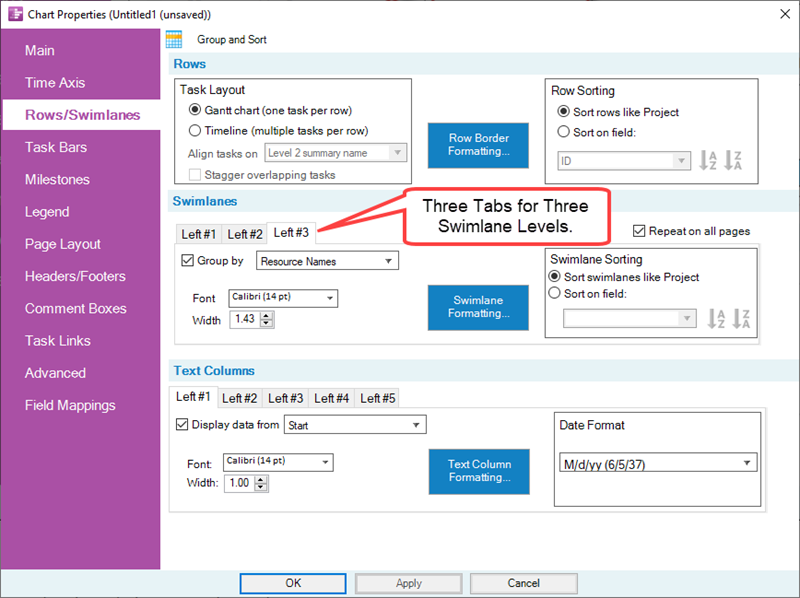
In addition to adding multiple swimlane levels, the tab shown above is simplified by reorganizing the controls associated with Rows and Text Columns. Sorting controls for rows and swimlanes are in separate sub-control groups as shown above. There is a Row Borders Formatting… button in the Rows control group with the controls for defining and global editing of row borders and access buttons for Swimlane Formatting… and Text Column Formatting… The controls shown above for the Chart Properties form are also found in the distributed Template Properties form’s Rows/Swimlanes tab. More detailed introductory information on the new Multiple Swimlane Levels feature can be found at these links:
| Using Rows and Swimlanes |
| Creating and Editing Rows and Swimlanes (Portal) |
Displaying Data-Driven Task Links
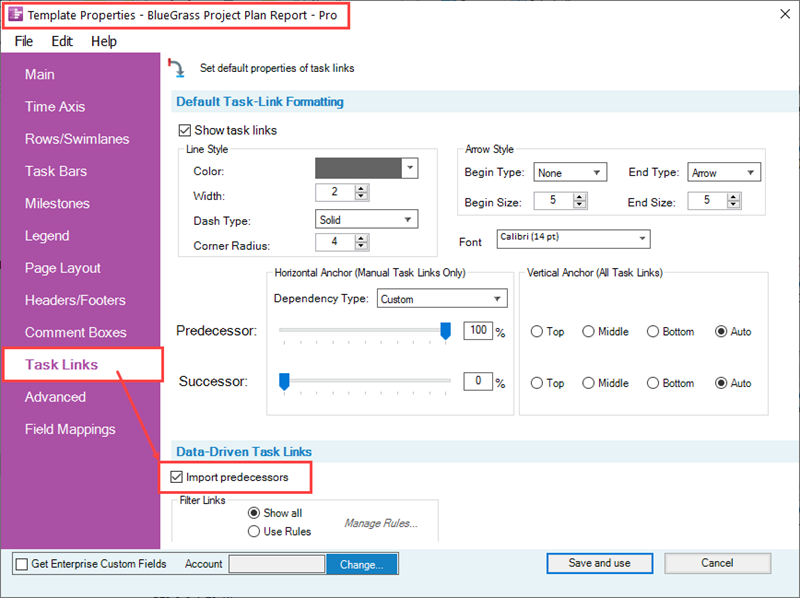
OnePager Pro 7.0 is enhanced to assist you with displaying Microsoft Project Predecessor fields in your chart. Typically, this feature is turned OFF in all Template Properties forms distributed with OnePager. However, the feature can be turned ON either before or after the creation of a chart. To turn the Data-Driven Task Link feature ON prior to creating a chart, go to the Template Properties form you plan to uses and click on the Task Links tab and then click the Import predecessors checkbox in the Data-Driven Task Links control group as shown below:
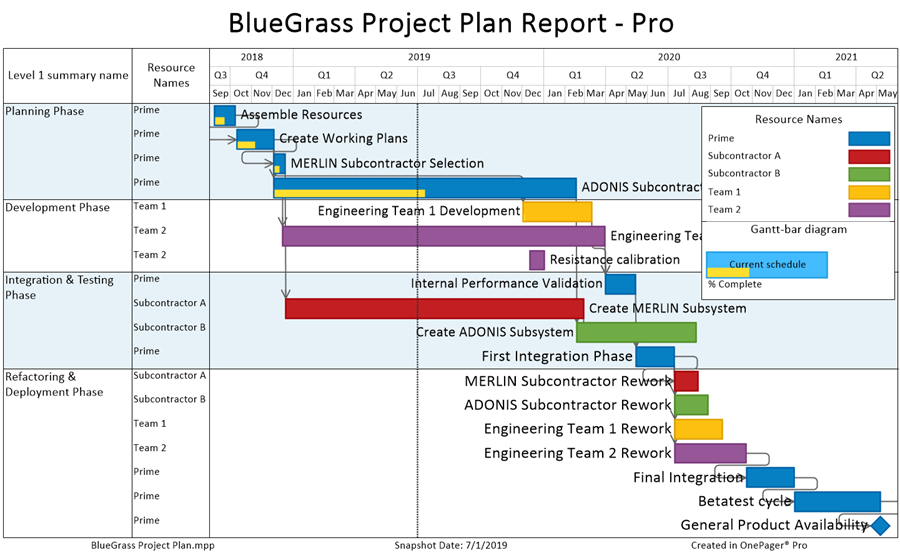
With the Import predecessors checkbox checked ON in the Template Properties form, the chart first created looks like this:
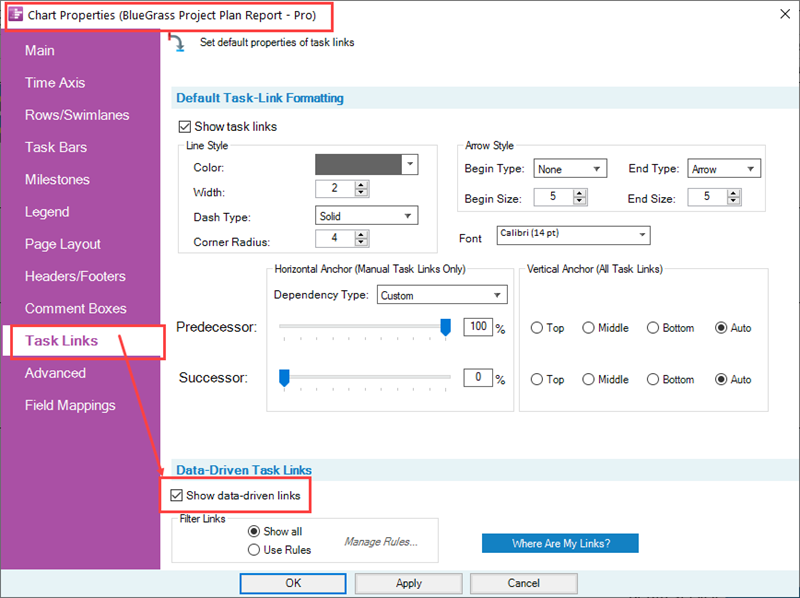
To turn the Data-Driven Task Link feature ON after the chart is created, go to the Chart Properties form's Task Links tab and then click the Import predecessors checkbox ON in the Data-Driven Task Links control group as shown below:
Once imported, Data-Driven Task Links can be shown or hidden and can be edited globally using the Template Properties or Chart Properties forms as shown above or individually using a task link right-click context menu. OnePager Pro 7.0 continues to support manual Task Links which in previous OnePager Pro versions were called Event Links. The OnePager version 7.0 Data-Driven Task Links feature is flexible and powerful.
More details are provided in the series of articles at: Linking Task and Milestone Using Manual and Data-Driven Task Links (Portal)
Editing the Time Axis
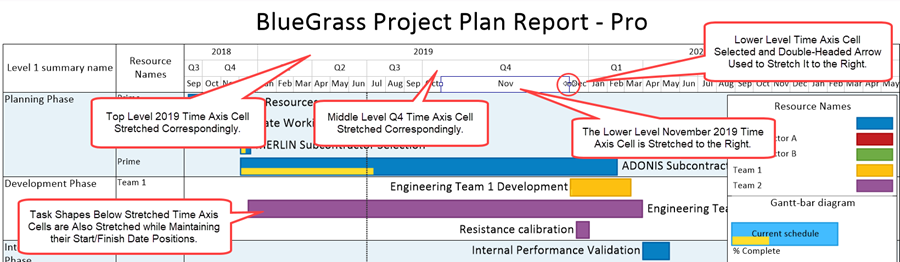
OnePager Pro is also enhanced with new capabilities and feature so you can edit the time axis and configure it to focus on specific time periods of interest in your project schedule presentation. As an example of the enhancements made to the time axis is the addition of the time axis cell stretch feature where you can lengthen the horizontal extend of any time axis cell so as to provide more space to focus on details within that time period. An example of a stretched lower level time axis cell is shown below:
For additional detailed information on the editing of time axis cells and other related capabilities please see this article at: Modifying the Time Axis (Portal)
Related Links
What's New with OnePager Release 7.0?
Getting Started with OnePager Pro Desktop
Conditional Import Filters (Portal)
Manual Editing Task/Milestone Shapes and Text Labels (Portal)
Creating and Editing Rows and Swimlanes (Portal)
Linking Task and Milestone Using Manual and Data-Driven Task Links (Portal)
Modifying the Time Axis (Portal)
(3.0.1.1-70)