Difference between revisions of "Using Functions with Text Columns, Rows, and Swimlanes for OnePager for Version 7.2"
(→Related Links) |
(→Function Options for Text Columns, Rows, and Swimlanes in Conditional Formatting Rules) |
||
| (2 intermediate revisions by the same user not shown) | |||
| Line 20: | Line 20: | ||
<center> | <center> | ||
{| class="wikitable" | {| class="wikitable" | ||
| − | |[[Using Functions with Text Columns, Rows, and Swimlanes for OnePager for Version 7.2#About Function Options Available in the Template/Chart Properties Form’s Rows/Swimlanes Tab | About Function Options Available in the Template/Chart Properties Form’s Rows/Swimlanes Tab]] 12.07.1-72 | + | |[[Using Functions with Text Columns, Rows, and Swimlanes for OnePager for Version 7.2#About Function Options Available in the Template/Chart Properties Form’s Rows/Swimlanes Tab | About Function Options Available in the Template/Chart Properties Form’s Rows/Swimlanes Tab]] <!--12.07.1-72--> |
|- | |- | ||
| − | |[[Using Functions with Text Columns, Rows, and Swimlanes for OnePager for Version 7.2#Example Use of Function Options in Conditional Formatting for Text Columns & Rows | Example Use of Function Options in Conditional Formatting for Text Columns & Rows]] 12.07.1-72 | + | |[[Using Functions with Text Columns, Rows, and Swimlanes for OnePager for Version 7.2#Example Use of Function Options in Conditional Formatting for Text Columns & Rows | Example Use of Function Options in Conditional Formatting for Text Columns & Rows]] <!--12.07.1-72--> |
|- | |- | ||
| − | |[[Using Functions with Text Columns, Rows, and Swimlanes for OnePager for Version 7.2#Example Use of Function Options Use in Conditional Formatting for Swimlanes | Example Use of Function Options Use in Conditional Formatting for Swimlanes]] 12.07.1-72 | + | |[[Using Functions with Text Columns, Rows, and Swimlanes for OnePager for Version 7.2#Example Use of Function Options Use in Conditional Formatting for Swimlanes | Example Use of Function Options Use in Conditional Formatting for Swimlanes]] <!--12.07.1-72--> |
|} | |} | ||
</center> | </center> | ||
| Line 46: | Line 46: | ||
<center>[[File:P72-12_07_1-72-(0)-07062023.png]]</center> | <center>[[File:P72-12_07_1-72-(0)-07062023.png]]</center> | ||
| − | <center>P72-12_07_1-72-(0)-07062023.png</center> | + | <!--<center>P72-12_07_1-72-(0)-07062023.png</center>--> |
In the above '''Rows/Swimlanes''' tab’s '''Rows''' control group illustration, the '''Task Layout''' sub-control group specifies the '''Timeline '''Layout. Assume that the chart consists of multiple '''rows''' of multiple task bars/milestone symbols each and you need to '''sort rows''' in '''swimlane''', say on '''Start date''', from top to bottom in the '''swimlane'''. Since there are multiple '''Start dates''' associated with the set of task bar/milestone symbols in each of the several '''rows''', you need a way to '''aggregate''' down to '''one value''' to control the '''sort'''. This is where the '''function option''' comes into play. As shown above, the '''Function options''' checkbox is checked '''ON''' because the chart is in the '''Timeline''' Layout and the '''Sort on field:''' radio button is selected '''enabling''' the '''Function options''' checkbox and the dropdown list. | In the above '''Rows/Swimlanes''' tab’s '''Rows''' control group illustration, the '''Task Layout''' sub-control group specifies the '''Timeline '''Layout. Assume that the chart consists of multiple '''rows''' of multiple task bars/milestone symbols each and you need to '''sort rows''' in '''swimlane''', say on '''Start date''', from top to bottom in the '''swimlane'''. Since there are multiple '''Start dates''' associated with the set of task bar/milestone symbols in each of the several '''rows''', you need a way to '''aggregate''' down to '''one value''' to control the '''sort'''. This is where the '''function option''' comes into play. As shown above, the '''Function options''' checkbox is checked '''ON''' because the chart is in the '''Timeline''' Layout and the '''Sort on field:''' radio button is selected '''enabling''' the '''Function options''' checkbox and the dropdown list. | ||
| Line 57: | Line 57: | ||
<center>[[File:P72-12_07_1-72-(0A-1)-07212023.png]]</center> | <center>[[File:P72-12_07_1-72-(0A-1)-07212023.png]]</center> | ||
| − | <center>P72-12_07_1-72-(0A-1)-07212023.png</center> | + | <!--<center>P72-12_07_1-72-(0A-1)-07212023.png</center>--> |
In the above '''Rows/Swimlanes''' tab’s '''Swimlanes''' control group, the '''Left#1 '''sub-tab has the '''Group by''' checkbox checked '''ON''' and the '''Level1 summary name''' selected for '''grouping swimlanes'''. Assume that the chart consists of '''swimlanes''' containing multiple task bars/milestone symbols and you need to '''sort''' '''swimlanes''' in the chart, say on '''Start date''', from top to bottom in the '''chart'''. Since there are multiple '''Start dates''' associated with each task bar/milestone symbol in each '''swimlane''', you need a way to '''aggregate''' down to '''one value''' to control the '''sort''' of the multiple '''swimlanes'''. Again, this is where the '''function option''' comes into play. | In the above '''Rows/Swimlanes''' tab’s '''Swimlanes''' control group, the '''Left#1 '''sub-tab has the '''Group by''' checkbox checked '''ON''' and the '''Level1 summary name''' selected for '''grouping swimlanes'''. Assume that the chart consists of '''swimlanes''' containing multiple task bars/milestone symbols and you need to '''sort''' '''swimlanes''' in the chart, say on '''Start date''', from top to bottom in the '''chart'''. Since there are multiple '''Start dates''' associated with each task bar/milestone symbol in each '''swimlane''', you need a way to '''aggregate''' down to '''one value''' to control the '''sort''' of the multiple '''swimlanes'''. Again, this is where the '''function option''' comes into play. | ||
| Line 68: | Line 68: | ||
<center>[[File:P72-12_07_1-72-(0B-1)-07212023.png]]</center> | <center>[[File:P72-12_07_1-72-(0B-1)-07212023.png]]</center> | ||
| − | <center>P72-12_07_1-72-(0B-1)-07212023.png</center> | + | <!--<center>P72-12_07_1-72-(0B-1)-07212023.png</center>--> |
Above, in the '''Text Columns''' control group, the '''Left#1 text column''' is set up to '''Display data from''' each '''row’s''' task bars/milestone symbol’s '''Start date'''. If there are multiple task bars/milestone symbols in the '''row''', OnePager needs a way to '''aggregate''' down to one '''value to display''' in the '''row’s text column cell'''. Once more, the '''function option''' is used. In the case above, OnePager uses the '''Average function option''', examines all the '''Start dates''' for all task bars in the '''row''', calculates the '''average value''' and displays that value in the '''row’s text column cell'''. Prior to the OnePager Version 7.2 release, OnePager always '''aggregated''' the values into a single value for displaying in each cell but gave you no visibility into what it was doing. The '''function''' that was used is called '''Legacy'''. | Above, in the '''Text Columns''' control group, the '''Left#1 text column''' is set up to '''Display data from''' each '''row’s''' task bars/milestone symbol’s '''Start date'''. If there are multiple task bars/milestone symbols in the '''row''', OnePager needs a way to '''aggregate''' down to one '''value to display''' in the '''row’s text column cell'''. Once more, the '''function option''' is used. In the case above, OnePager uses the '''Average function option''', examines all the '''Start dates''' for all task bars in the '''row''', calculates the '''average value''' and displays that value in the '''row’s text column cell'''. Prior to the OnePager Version 7.2 release, OnePager always '''aggregated''' the values into a single value for displaying in each cell but gave you no visibility into what it was doing. The '''function''' that was used is called '''Legacy'''. | ||
| Line 77: | Line 77: | ||
<center>[[File:P72-12_07_1-72-(0BD)-07212023.png]]</center> | <center>[[File:P72-12_07_1-72-(0BD)-07212023.png]]</center> | ||
| − | <center>P72-12_07_1-72-(0BD)-07212023.png</center> | + | <!--<center>P72-12_07_1-72-(0BD)-07212023.png</center>--> |
Since the '''text column cell values''' are being determined by the '''aggregation method''' you selected in the '''Function option '''dropdown list, OnePager '''augments''' the '''Text Column heading''' by adding a '''parenthetical adjective''' to describe the '''Function option '''used. In the case illustrated with the '''Chart Properties''' form shown above, the '''Left#1 Text Column''' is set to display '''Start date''' and the '''Function option''' selected is the '''Average'''. OnePager sets the '''Left#1 Text Column heading''' to '''Start''' and, because the '''Average Function option''' is selected, OnePager adds parenthetical '''text '''to the '''Left#1 Text Column heading''' indicating the '''Function option '''selected as shown below: | Since the '''text column cell values''' are being determined by the '''aggregation method''' you selected in the '''Function option '''dropdown list, OnePager '''augments''' the '''Text Column heading''' by adding a '''parenthetical adjective''' to describe the '''Function option '''used. In the case illustrated with the '''Chart Properties''' form shown above, the '''Left#1 Text Column''' is set to display '''Start date''' and the '''Function option''' selected is the '''Average'''. OnePager sets the '''Left#1 Text Column heading''' to '''Start''' and, because the '''Average Function option''' is selected, OnePager adds parenthetical '''text '''to the '''Left#1 Text Column heading''' indicating the '''Function option '''selected as shown below: | ||
<center>[[File:P72-12_07_1-72-(0BA-1)-08072023.png]]</center> | <center>[[File:P72-12_07_1-72-(0BA-1)-08072023.png]]</center> | ||
| − | <center>P72-12_07_1-72-(0BA-1)-08072023.png</center> | + | <!--<center>P72-12_07_1-72-(0BA-1)-08072023.png</center>--> |
===Using Functions in Conditional Formatting for Text Columns & Rows Form Rules=== | ===Using Functions in Conditional Formatting for Text Columns & Rows Form Rules=== | ||
| Line 91: | Line 91: | ||
<center>[[File:P72-12_07_1-72-(0C-1)-07212023.png]]</center> | <center>[[File:P72-12_07_1-72-(0C-1)-07212023.png]]</center> | ||
| − | <center>P72-12_07_1-72-(0C-1)-07212023.png</center> | + | <!--<center>P72-12_07_1-72-(0C-1)-07212023.png</center>--> |
In the above form, the '''Function column''' has a dropdown whose contents are determined by the '''Field type''' specified in the '''Field column''' to the left. Similarly, the '''Operator column''' dropdown contains '''operator options''' associated with the '''Field type''' specified in the '''Field column'''. The '''Function''' dropdown includes '''additional options''' that were not applicable to the '''row-sorting''' or the contents of '''text column cell''' cases discussed above. This is because there are '''rule conditions''' (e.g. “at least one value in the row is 0”) that do not require '''aggregating''' all the values in the '''row''' into a single value. | In the above form, the '''Function column''' has a dropdown whose contents are determined by the '''Field type''' specified in the '''Field column''' to the left. Similarly, the '''Operator column''' dropdown contains '''operator options''' associated with the '''Field type''' specified in the '''Field column'''. The '''Function''' dropdown includes '''additional options''' that were not applicable to the '''row-sorting''' or the contents of '''text column cell''' cases discussed above. This is because there are '''rule conditions''' (e.g. “at least one value in the row is 0”) that do not require '''aggregating''' all the values in the '''row''' into a single value. | ||
| Line 100: | Line 100: | ||
<center>[[File:P72-12_07_1-72-(0CA)-07212023.png]]</center> | <center>[[File:P72-12_07_1-72-(0CA)-07212023.png]]</center> | ||
| − | <center>P72-12_07_1-72-(0CA)-07212023.png</center> | + | <!--<center>P72-12_07_1-72-(0CA)-07212023.png</center>--> |
The '''Function option''' in the '''Text Columns''' control group is always '''ENABLED''' and is available to be turned '''ON''' at any time (clicking the '''Function''' checkbox '''ON''' in the '''Text Columns''' control group). As described above, when this '''Function option''' control is used, it serves to '''aggregate''' multiple task bar/milestone values into a single value for each '''row''' and inserts an '''adjective''' in the '''Text Column heading''' to clarify the '''Function option''' being used. | The '''Function option''' in the '''Text Columns''' control group is always '''ENABLED''' and is available to be turned '''ON''' at any time (clicking the '''Function''' checkbox '''ON''' in the '''Text Columns''' control group). As described above, when this '''Function option''' control is used, it serves to '''aggregate''' multiple task bar/milestone values into a single value for each '''row''' and inserts an '''adjective''' in the '''Text Column heading''' to clarify the '''Function option''' being used. | ||
| Line 113: | Line 113: | ||
<center>[[File:P72-12_07_1-72-(0BB)-07202023.png]]</center> | <center>[[File:P72-12_07_1-72-(0BB)-07202023.png]]</center> | ||
| − | <center>P72-12_07_1-72-(0BB)-07202023.png</center> | + | <!--<center>P72-12_07_1-72-(0BB)-07202023.png</center>--> |
'''Function option''' controls are included in the '''Conditional Formatting for Swimlanes''' form because, as noted above, '''source plans''' almost always create OnePager charts where there are multiple task bars/milestone symbols per '''swimlane''' and '''conditional formatting rule conditions''' (i.e., '''field''', '''operator''', '''function''', and '''value''' columns) need to '''aggregate '''multiple values to establish a single '''TRUE''' or '''FALSE''' result on each '''swimlane'''. Once the '''rule condition''' is established, the '''rule’s actions''' can be '''applied''' to the '''swimlane label cell''' and/or '''swimlanes''' in the chart. | '''Function option''' controls are included in the '''Conditional Formatting for Swimlanes''' form because, as noted above, '''source plans''' almost always create OnePager charts where there are multiple task bars/milestone symbols per '''swimlane''' and '''conditional formatting rule conditions''' (i.e., '''field''', '''operator''', '''function''', and '''value''' columns) need to '''aggregate '''multiple values to establish a single '''TRUE''' or '''FALSE''' result on each '''swimlane'''. Once the '''rule condition''' is established, the '''rule’s actions''' can be '''applied''' to the '''swimlane label cell''' and/or '''swimlanes''' in the chart. | ||
| Line 120: | Line 120: | ||
<center>[[File:P72-11_19_1-72-(20-1)-07312023.png]]</center> | <center>[[File:P72-11_19_1-72-(20-1)-07312023.png]]</center> | ||
| − | <center>P72-11_19_1-72-(20-1)-07312023.png</center> | + | <!--<center>P72-11_19_1-72-(20-1)-07312023.png</center>--> |
In the '''Conditional Formatting for Swimlanes''' form, shown above, you have the same '''Rule Condition Columns''' that are standard in all OnePager '''Conditional Formatting Rules''' forms. There are three '''Rule Action columns''': (1) '''Label Font''', (2) '''Swimlane Cell Background''' ('''color'''), and (3) '''Swimlane Background''' ('''color'''). The '''Priority''' column is provided, as in '''all Conditional Formatting Rules '''forms. | In the '''Conditional Formatting for Swimlanes''' form, shown above, you have the same '''Rule Condition Columns''' that are standard in all OnePager '''Conditional Formatting Rules''' forms. There are three '''Rule Action columns''': (1) '''Label Font''', (2) '''Swimlane Cell Background''' ('''color'''), and (3) '''Swimlane Background''' ('''color'''). The '''Priority''' column is provided, as in '''all Conditional Formatting Rules '''forms. | ||
| Line 131: | Line 131: | ||
<center>[[File:P72-12_07_1-72-(21)-08072023.png]]</center> | <center>[[File:P72-12_07_1-72-(21)-08072023.png]]</center> | ||
| − | <center>P72-12_07_1-72-(21)-08072023.png</center> | + | <!--<center>P72-12_07_1-72-(21)-08072023.png</center>--> |
Like '''Swimlane Label cells''' OnePager provides the capability for you to use '''function options''' to establish the contents of the '''Swimlane Label Heading Cell'''. This feature gives you the capability to '''aggregate''' multiple possible '''swimlane label headings''' to a '''specific swimlane label heading''' appropriate for the '''swimlane’s cell contents'''. As with the other implementations of '''function options''', the '''functions options''' provided in the dropdown list are dependent on the '''Field type''' contained in the '''Label by:''' dropdown in the above form. | Like '''Swimlane Label cells''' OnePager provides the capability for you to use '''function options''' to establish the contents of the '''Swimlane Label Heading Cell'''. This feature gives you the capability to '''aggregate''' multiple possible '''swimlane label headings''' to a '''specific swimlane label heading''' appropriate for the '''swimlane’s cell contents'''. As with the other implementations of '''function options''', the '''functions options''' provided in the dropdown list are dependent on the '''Field type''' contained in the '''Label by:''' dropdown in the above form. | ||
| Line 307: | Line 307: | ||
<center> | <center> | ||
{| class="wikitable" | {| class="wikitable" | ||
| − | | [[Conditional Formatting for Version 7.2 (Portal) | Conditional Formatting (Portal)]] 11.0.1-72 | + | | [[Conditional Formatting for Version 7.2 (Portal) | Conditional Formatting (Portal)]] <!--11.0.1-72--> |
|- | |- | ||
| − | | [[Conditional Formatting Rules for Text Columns and Rows for OnePager for Version 7.2 | Conditional Formatting Rules for Text Columns and Rows]] 11.17.1-72 | + | | [[Conditional Formatting Rules for Text Columns and Rows for OnePager for Version 7.2 | Conditional Formatting Rules for Text Columns and Rows]] <!--11.17.1-72--> |
|- | |- | ||
| − | | [[Conditional Formatting Rules for Swimlanes for OnePager for Version 7.2 | Conditional Formatting Rules for Swimlanes]] 11.19.1-72 | + | | [[Conditional Formatting Rules for Swimlanes for OnePager for Version 7.2 | Conditional Formatting Rules for Swimlanes]] <!--11.19.1-72--> |
|- | |- | ||
| − | | [[Collecting, Formatting, and Sorting Task/Milestones into Rows for Version 7.2 | Collecting, Formatting, and Sorting Task/Milestones into Rows]] 12.01.1-72 | + | | [[Collecting, Formatting, and Sorting Task/Milestones into Rows for Version 7.2 | Collecting, Formatting, and Sorting Task/Milestones into Rows]] <!--12.01.1-72--> |
|- | |- | ||
| − | | [[Creating, Formatting, and Sorting Swimlanes Levels for Version 7.2 | Creating, Formatting, and Sorting Swimlanes Levels]] 12.02.1-72 | + | | [[Creating, Formatting, and Sorting Swimlanes Levels for Version 7.2 | Creating, Formatting, and Sorting Swimlanes Levels]] <!--12.02.1-72--> |
|} | |} | ||
</center> | </center> | ||
| Line 326: | Line 326: | ||
<center>[[File:P72-12_07_1-72-(1A-1)-08072023.png]]</center> | <center>[[File:P72-12_07_1-72-(1A-1)-08072023.png]]</center> | ||
| − | <center>P72-12_07_1-72-(1A-1)-08072023.png</center> | + | <!--<center>P72-12_07_1-72-(1A-1)-08072023.png</center>--> |
Using a '''Timeline''' Layout OnePager '''Template Properties''' form, we can create a '''Timeline''' Layout chart that looks like this: | Using a '''Timeline''' Layout OnePager '''Template Properties''' form, we can create a '''Timeline''' Layout chart that looks like this: | ||
<center>[[File:P72-12_07_1-72-(1B-2)-08022023.png]]</center> | <center>[[File:P72-12_07_1-72-(1B-2)-08022023.png]]</center> | ||
| − | <center>P72-12_07_1-72-(1B-2)-08022023.png</center> | + | <!--<center>P72-12_07_1-72-(1B-2)-08022023.png</center>--> |
The above chart has multiple task bars and milestone symbols in a single '''row'''. The chart is organized such that the Clinical Trial Identifiers ('''Level 1 summary names''') are used to group the '''rows''' into '''swimlanes'''. The '''Template Properties form''' (distributed with the OnePager product) used for the above chart is specifically tailored to display task bars in the '''Timeline Layout''' hence one '''row''' per '''swimlane''' is shown. | The above chart has multiple task bars and milestone symbols in a single '''row'''. The chart is organized such that the Clinical Trial Identifiers ('''Level 1 summary names''') are used to group the '''rows''' into '''swimlanes'''. The '''Template Properties form''' (distributed with the OnePager product) used for the above chart is specifically tailored to display task bars in the '''Timeline Layout''' hence one '''row''' per '''swimlane''' is shown. | ||
| Line 552: | Line 552: | ||
The '''X '''in the '''cells''' of the above table indicates that the '''Function option''' is available for that '''Field Type'''. Accordingly, the '''function options''' available appears in the dropdown list for the '''Function column''' in the form specific for the '''Field type''' of the '''Field column cell''' as illustrated below for a '''text string''': | The '''X '''in the '''cells''' of the above table indicates that the '''Function option''' is available for that '''Field Type'''. Accordingly, the '''function options''' available appears in the dropdown list for the '''Function column''' in the form specific for the '''Field type''' of the '''Field column cell''' as illustrated below for a '''text string''': | ||
| − | <center>[[File:P72-12_07_1-72-(1- | + | <center>[[File:P72-12_07_1-72-(1-3)-03042024.png]]</center> |
| − | <center>P72-12_07_1-72-(1- | + | <!--<center>P72-12_07_1-72-(1-3)-03042024.png</center>--> |
==Interpretation of Function Options for Conditional Formatting for Text Columns & Rows and Swimlanes== | ==Interpretation of Function Options for Conditional Formatting for Text Columns & Rows and Swimlanes== | ||
| Line 605: | Line 605: | ||
==Columns That Control Which Text Gets Displayed== | ==Columns That Control Which Text Gets Displayed== | ||
| − | The '''Custom''' '''Text''' and '''Which text '''columns are provided only in the ''' | + | The '''Custom''' '''Text''' and '''Which text '''columns are provided only in the '''Conditional Formatting for Text Columns & Rows''' form and are enabled only when '''Display As''' is set to Text. |
===Custom Text Column=== | ===Custom Text Column=== | ||
| Line 625: | Line 625: | ||
<center>'''Chart Properties Form’s Rows/Swimlanes Tab'''</center> | <center>'''Chart Properties Form’s Rows/Swimlanes Tab'''</center> | ||
<center>[[File:P72-12_07_1-72-(10-1)-08082023.png]]</center> | <center>[[File:P72-12_07_1-72-(10-1)-08082023.png]]</center> | ||
| − | <center>P72-12_07_1-72-(10-1)-08082023.png</center> | + | <!--<center>P72-12_07_1-72-(10-1)-08082023.png</center>--> |
<center>'''Conditional Formatting for Text Columns & Rows Form'''</center> | <center>'''Conditional Formatting for Text Columns & Rows Form'''</center> | ||
<center>[[File:P72-12_07_1-72-(11-2)-08082023.png]]</center> | <center>[[File:P72-12_07_1-72-(11-2)-08082023.png]]</center> | ||
| − | <center>P72-12_07_1-72-(11-2)-08082023.png</center> | + | <!--<center>P72-12_07_1-72-(11-2)-08082023.png</center>--> |
The combination of the use of the '''Maximum Function Option''' for the '''Left#2 Text Column''' for the '''Start date field '''and the '''Conditional Formatting for Text Columns & Rows''' form rule is to highlight those '''Text Column cells''' where the '''maximum start date''' is beyond '''January 1, 2030'''. When these conditions are me, the '''Conditional Formatting for Text Columns & Rows rule''' changes the '''text font''' and the '''background color''' for the appropriate '''Text Column cells''' as shown below: | The combination of the use of the '''Maximum Function Option''' for the '''Left#2 Text Column''' for the '''Start date field '''and the '''Conditional Formatting for Text Columns & Rows''' form rule is to highlight those '''Text Column cells''' where the '''maximum start date''' is beyond '''January 1, 2030'''. When these conditions are me, the '''Conditional Formatting for Text Columns & Rows rule''' changes the '''text font''' and the '''background color''' for the appropriate '''Text Column cells''' as shown below: | ||
<center>[[File:P72-12_07_1-72-(12-1)-08082023.png]]</center> | <center>[[File:P72-12_07_1-72-(12-1)-08082023.png]]</center> | ||
| − | <center>P72-12_07_1-72-(12-1)-08082023.png</center> | + | <!--<center>P72-12_07_1-72-(12-1)-08082023.png</center>--> |
==Example Use of Function Options in Conditional Formatting for Text Columns & Rows== | ==Example Use of Function Options in Conditional Formatting for Text Columns & Rows== | ||
| Line 652: | Line 652: | ||
<center>'''Rows/Swimlanes Form – Text Columns-Left#1'''</center> | <center>'''Rows/Swimlanes Form – Text Columns-Left#1'''</center> | ||
<center>[[File:P72-12_07_1-72-(1CA)-08092023.png]]</center> | <center>[[File:P72-12_07_1-72-(1CA)-08092023.png]]</center> | ||
| − | <center>P72-12_07_1-72-(1CA)-08092023.png</center> | + | <!--<center>P72-12_07_1-72-(1CA)-08092023.png</center>--> |
Please note a few of the settings in the '''Chart Properties''' form’s '''Rows/Swimlanes '''tab above: | Please note a few of the settings in the '''Chart Properties''' form’s '''Rows/Swimlanes '''tab above: | ||
| Line 665: | Line 665: | ||
<center>'''Rows/Swimlanes Form – Text Columns-Left#2'''</center> | <center>'''Rows/Swimlanes Form – Text Columns-Left#2'''</center> | ||
<center>[[File:P72-12_07_1-72-(1CB)-08092023.png]]</center> | <center>[[File:P72-12_07_1-72-(1CB)-08092023.png]]</center> | ||
| − | <center>P72-12_07_1-72-(1CB)-08092023.png</center> | + | <!--<center>P72-12_07_1-72-(1CB)-08092023.png</center>--> |
Again, note the settings in the '''Chart Properties''' form’s '''Rows/Swimlanes '''tab above: | Again, note the settings in the '''Chart Properties''' form’s '''Rows/Swimlanes '''tab above: | ||
| Line 677: | Line 677: | ||
<center>[[File:P72-12_07_1-72-(1B-3)-08072023.png]]</center> | <center>[[File:P72-12_07_1-72-(1B-3)-08072023.png]]</center> | ||
| − | <center>P72-12_07_1-72-(1B-3)-08072023.png</center> | + | <!--<center>P72-12_07_1-72-(1B-3)-08072023.png</center>--> |
When the settings described above are '''applied''' to the original chart from the '''Rows/Swimlanes''' tab alone, the changed chart looks like this: | When the settings described above are '''applied''' to the original chart from the '''Rows/Swimlanes''' tab alone, the changed chart looks like this: | ||
<center>[[File:P72-12_07_1-72-(1E-3)-08092023.png]]</center> | <center>[[File:P72-12_07_1-72-(1E-3)-08092023.png]]</center> | ||
| − | <center>P72-12_07_1-72-(1E-3)-08092023.png</center> | + | <!--<center>P72-12_07_1-72-(1E-3)-08092023.png</center>--> |
Clicking the '''Manage Rules…''' button in the '''Text Columns''' control group accesses the '''Conditional Formatting for Text Columns & Rows '''form. Using the form, we can create '''rules''' to change the contents of the '''Left#1''' and '''Left#2 text column cells''' as shown below: | Clicking the '''Manage Rules…''' button in the '''Text Columns''' control group accesses the '''Conditional Formatting for Text Columns & Rows '''form. Using the form, we can create '''rules''' to change the contents of the '''Left#1''' and '''Left#2 text column cells''' as shown below: | ||
<center>[[File: P72-12_07_1-72-(1D-4)-08092023.png]]</center> | <center>[[File: P72-12_07_1-72-(1D-4)-08092023.png]]</center> | ||
| − | <center>P72-12_07_1-72-(1D-4)-08092023.png</center> | + | <!--<center>P72-12_07_1-72-(1D-4)-08092023.png</center>--> |
The intent of these two '''Conditional Formatting for Text Columns & Rows rules''' is to highlight the '''text''' and '''text column background colors''' for those '''text column cells''' having '''At Lease One Value''' for '''Start''' less that '''June 1, 2019''' and '''At Least One Value''' for '''Finish''' greater than '''June 15, 2029'''. | The intent of these two '''Conditional Formatting for Text Columns & Rows rules''' is to highlight the '''text''' and '''text column background colors''' for those '''text column cells''' having '''At Lease One Value''' for '''Start''' less that '''June 1, 2019''' and '''At Least One Value''' for '''Finish''' greater than '''June 15, 2029'''. | ||
| Line 696: | Line 696: | ||
<center>[[File:P72-12_07_1-72-(1F-3)-08092023.png]]</center> | <center>[[File:P72-12_07_1-72-(1F-3)-08092023.png]]</center> | ||
| − | <center>P72-12_07_1-72-(1F-3)-08092023.png</center> | + | <!--<center>P72-12_07_1-72-(1F-3)-08092023.png</center>--> |
===Function Option Example (2): Mode=== | ===Function Option Example (2): Mode=== | ||
| Line 705: | Line 705: | ||
<center>[[File:P72-12_07_1-72-(1GA)-08092023.png]]</center> | <center>[[File:P72-12_07_1-72-(1GA)-08092023.png]]</center> | ||
| − | <center>P72-12_07_1-72-(1GA)-08092023.png</center> | + | <!--<center>P72-12_07_1-72-(1GA)-08092023.png</center>--> |
Clicking the '''Manage Rules…''' button accesses the '''Conditional Formatting for Text Columns & Rows '''form with a '''rule''' to change the contents of the '''Left#1 text column cell''' as shown below: | Clicking the '''Manage Rules…''' button accesses the '''Conditional Formatting for Text Columns & Rows '''form with a '''rule''' to change the contents of the '''Left#1 text column cell''' as shown below: | ||
<center>[[File:P72-12_07_1-72-(1G-2)-08092023.png]]</center> | <center>[[File:P72-12_07_1-72-(1G-2)-08092023.png]]</center> | ||
| − | <center>P72-12_07_1-72-(1G-2)-08092023.png</center> | + | <!--<center>P72-12_07_1-72-(1G-2)-08092023.png</center>--> |
The purpose of the above '''Conditional Formatting for Text Columns & Rows rule''' is to highlight those Portforlio efforts that are taking place in the '''European Region''' with a '''Red Diamond''' symbol. | The purpose of the above '''Conditional Formatting for Text Columns & Rows rule''' is to highlight those Portforlio efforts that are taking place in the '''European Region''' with a '''Red Diamond''' symbol. | ||
| Line 717: | Line 717: | ||
<center>[[File:P72-12_07_1-72-(1H-3)-08092023.png]]</center> | <center>[[File:P72-12_07_1-72-(1H-3)-08092023.png]]</center> | ||
| − | <center>P72-12_07_1-72-(1H-3)-08092023.png</center> | + | <!--<center>P72-12_07_1-72-(1H-3)-08092023.png</center>--> |
'''Conditional Formatting for Text Columns & Row rules''' can be used in this manner to highlight '''text columns''' and '''rows '''with '''color''', '''text comments''', '''dynamic symbols''', and/or '''emojis''' to direct the attention of your audience to specific issues. | '''Conditional Formatting for Text Columns & Row rules''' can be used in this manner to highlight '''text columns''' and '''rows '''with '''color''', '''text comments''', '''dynamic symbols''', and/or '''emojis''' to direct the attention of your audience to specific issues. | ||
| Line 732: | Line 732: | ||
<center>[[File:P72-12_07_1-72-(5)-08042023.png]]</center> | <center>[[File:P72-12_07_1-72-(5)-08042023.png]]</center> | ||
| − | <center>P72-12_07_1-72-(5)-08042023.png</center> | + | <!--<center>P72-12_07_1-72-(5)-08042023.png</center>--> |
Before going further, please note a few of the settings in the '''Chart Properties''' form’s '''Rows/Swimlanes '''tab above: | Before going further, please note a few of the settings in the '''Chart Properties''' form’s '''Rows/Swimlanes '''tab above: | ||
| Line 743: | Line 743: | ||
<center>[[File:P72-12_07_1-72-(1B-2)-08022023.png]]</center> | <center>[[File:P72-12_07_1-72-(1B-2)-08022023.png]]</center> | ||
| − | <center>P72-12_07_1-72-(1B-2)-08022023.png</center> | + | <!--<center>P72-12_07_1-72-(1B-2)-08022023.png</center>--> |
Clicking the '''Manage Rules…''' button in the '''Swimlanes''' control group accesses the '''Conditional Formatting for Swimlanes '''form. Using the form, we can create '''rules''' to change the look of the '''Left#1 swimlane level cells''' as shown below: | Clicking the '''Manage Rules…''' button in the '''Swimlanes''' control group accesses the '''Conditional Formatting for Swimlanes '''form. Using the form, we can create '''rules''' to change the look of the '''Left#1 swimlane level cells''' as shown below: | ||
<center>[[File:P72-12_07_1-72-(6)-08042023.png]]</center> | <center>[[File:P72-12_07_1-72-(6)-08042023.png]]</center> | ||
| − | <center>P72-12_07_1-72-(6)-08042023.png</center> | + | <!--<center>P72-12_07_1-72-(6)-08042023.png</center>--> |
The four '''conditional formatting swimlane rules''' look for the '''text string values''' shown in the '''Value''' column and when found, change the '''Left#1 swimlane cell’s background color''' to the color selected in the '''Cell Background''' column as shown below: | The four '''conditional formatting swimlane rules''' look for the '''text string values''' shown in the '''Value''' column and when found, change the '''Left#1 swimlane cell’s background color''' to the color selected in the '''Cell Background''' column as shown below: | ||
<center>[[File:P72-12_07_1-72-(7)-08042023.png]]</center> | <center>[[File:P72-12_07_1-72-(7)-08042023.png]]</center> | ||
| − | <center>P72-12_07_1-72-(7)-08042023.png</center> | + | <!--<center>P72-12_07_1-72-(7)-08042023.png</center>--> |
In the above chart all the '''Conditional Formatting Swimlane rules''' are '''TRUE''' for the top four '''swimlanes''' so the '''Left#1 swimlane name cells''' have their '''Cell Background colors''' changed to the '''values''' selected in the '''Conditional Formatting for Swimlanes''' form shown above. | In the above chart all the '''Conditional Formatting Swimlane rules''' are '''TRUE''' for the top four '''swimlanes''' so the '''Left#1 swimlane name cells''' have their '''Cell Background colors''' changed to the '''values''' selected in the '''Conditional Formatting for Swimlanes''' form shown above. | ||
| Line 761: | Line 761: | ||
The example below uses the '''At Least One Value function option'''. '''At Least One Value''' means that at '''least one''' of the set of '''values''' from all task bars/milestone symbols in the '''swimlane''' must satisfy the '''conditional formatting rule''' in order to make the '''condition formatting rule TRUE'''. | The example below uses the '''At Least One Value function option'''. '''At Least One Value''' means that at '''least one''' of the set of '''values''' from all task bars/milestone symbols in the '''swimlane''' must satisfy the '''conditional formatting rule''' in order to make the '''condition formatting rule TRUE'''. | ||
| − | |||
The remainder of the set up for this example is the same as the previous example. | The remainder of the set up for this example is the same as the previous example. | ||
| Line 767: | Line 766: | ||
<center>[[File:P72-12_07_1-72-(8)-08042023.png]]</center> | <center>[[File:P72-12_07_1-72-(8)-08042023.png]]</center> | ||
| − | <center>P72-12_07_1-72-(8)-08042023.png</center> | + | <!--<center>P72-12_07_1-72-(8)-08042023.png</center>--> |
The added '''fifth rule''' states that if the '''Start date''' for any task bar/milestone symbol in the chart has a '''value''' greater than or equal to '''January 1, 2030''', change the '''Left#1 swimlane name label cell''' to dark red with '''Priority 4'''. When the '''Conditional Formatting for Swimlanes rule''' is '''applied''' to the above chart, the results look like this: | The added '''fifth rule''' states that if the '''Start date''' for any task bar/milestone symbol in the chart has a '''value''' greater than or equal to '''January 1, 2030''', change the '''Left#1 swimlane name label cell''' to dark red with '''Priority 4'''. When the '''Conditional Formatting for Swimlanes rule''' is '''applied''' to the above chart, the results look like this: | ||
<center>[[File:P72-12_07_1-72-(9)-08042023.png]]</center> | <center>[[File:P72-12_07_1-72-(9)-08042023.png]]</center> | ||
| − | <center>P72-12_07_1-72-(9)-08042023.png</center> | + | <!--<center>P72-12_07_1-72-(9)-08042023.png</center>--> |
In the above chart, the '''top four swimlanes''' remain unchanged. With the addition of the '''fifth conditional formatting for swimlanes rule''', because the preceding four '''rule’s priority''' are '''higher''' than the '''fifth rule''' we added, the remain '''swimlanes''' below the '''top four''' are subject to the '''fifth rule''' because none of their '''Left#1 summary name’s '''contain the '''values''' specified in '''the top four rules''' stated in the '''Conditional Formatting for Swimlanes''' form. The '''swimlane''' label '''NDC-6258-1622-18''' is unchanged because the '''fifth rule''' is '''FALSE''' for that '''swimlane '''because there is no '''Start date''' in that '''swimlane''' where a task bar/milestone symbol has a '''Start date''' greater than or equal to '''January 1, 2030'''. | In the above chart, the '''top four swimlanes''' remain unchanged. With the addition of the '''fifth conditional formatting for swimlanes rule''', because the preceding four '''rule’s priority''' are '''higher''' than the '''fifth rule''' we added, the remain '''swimlanes''' below the '''top four''' are subject to the '''fifth rule''' because none of their '''Left#1 summary name’s '''contain the '''values''' specified in '''the top four rules''' stated in the '''Conditional Formatting for Swimlanes''' form. The '''swimlane''' label '''NDC-6258-1622-18''' is unchanged because the '''fifth rule''' is '''FALSE''' for that '''swimlane '''because there is no '''Start date''' in that '''swimlane''' where a task bar/milestone symbol has a '''Start date''' greater than or equal to '''January 1, 2030'''. | ||
| Line 784: | Line 783: | ||
<center> | <center> | ||
{| class="wikitable" | {| class="wikitable" | ||
| − | | [[Example of Function Option Use for OnePager for Version 7.2 | Example of Function Option Use]] 0.4.10.3-72 | + | | [[Example of Function Option Use for OnePager for Version 7.2 | Example of Function Option Use]] <!--0.4.10.3-72--> |
|} | |} | ||
</center> | </center> | ||
| Line 795: | Line 794: | ||
{| class="wikitable" | {| class="wikitable" | ||
| − | | [[Conditional Formatting for Version 7.2 (Portal) | Conditional Formatting (Portal)]] 11.0.1-72 | + | | [[Conditional Formatting for Version 7.2 (Portal) | Conditional Formatting (Portal)]] <!--11.0.1-72--> |
| − | | [[Using Conditional Formatting Rules for Tracking Changes Between Snapshots for Version 7.2 | Using Conditional Formatting Rules for Tracking Changes Between Snapshots]] 11.3.3-72 | + | | [[Using Conditional Formatting Rules for Tracking Changes Between Snapshots for Version 7.2 | Using Conditional Formatting Rules for Tracking Changes Between Snapshots]] <!--11.3.3-72--> |
|- | |- | ||
| − | | [[Visualizing Changes between Snapshots for Version 7.2 | Visualizing Changes between Snapshots]] 11.3.5-72 | + | | [[Visualizing Changes between Snapshots for Version 7.2 | Visualizing Changes between Snapshots]] <!--11.3.5-72--> |
| − | | [[Conditional Formatting Rules for Task Bar/Milestone Symbol Decorations for OnePager for Version 7.2 | Conditional Formatting Rules for Task Bar/Milestone Symbol Decorations]] 11.15.3-72 | + | | [[Conditional Formatting Rules for Task Bar/Milestone Symbol Decorations for OnePager for Version 7.2 | Conditional Formatting Rules for Task Bar/Milestone Symbol Decorations]] <!--11.15.3-72--> |
|- | |- | ||
| − | | [[Conditional Formatting Rules for Text Columns and Rows for OnePager for Version 7.2 | Conditional Formatting Rules for Text Columns and Rows]] 11.17.1-72 | + | | [[Conditional Formatting Rules for Text Columns and Rows for OnePager for Version 7.2 | Conditional Formatting Rules for Text Columns and Rows]] <!--11.17.1-72--> |
| − | | [[Conditional Formatting Rules for Swimlanes for OnePager for Version 7.2 | Conditional Formatting Rules for Swimlanes]] 11.19.1-72 | + | | [[Conditional Formatting Rules for Swimlanes for OnePager for Version 7.2 | Conditional Formatting Rules for Swimlanes]] <!--11.19.1-72--> |
|- | |- | ||
| − | | [[Collecting, Formatting, and Sorting Task/Milestones into Rows for Version 7.2 | Collecting, Formatting, and Sorting Task/Milestones into Rows]] 12.01.1-72 | + | | [[Collecting, Formatting, and Sorting Task/Milestones into Rows for Version 7.2 | Collecting, Formatting, and Sorting Task/Milestones into Rows]] <!--12.01.1-72--> |
| − | | [[Creating, Formatting, and Sorting Swimlanes Levels for Version 7.2 | Creating, Formatting, and Sorting Swimlanes Levels]] 12.02.1-72 | + | | [[Creating, Formatting, and Sorting Swimlanes Levels for Version 7.2 | Creating, Formatting, and Sorting Swimlanes Levels]] <!--12.02.1-72--> |
|- | |- | ||
| − | | [[Creating and Formatting Text Columns for Version 7.2 | Creating and Formatting Text Columns]] 12.03.1-72 | + | | [[Creating and Formatting Text Columns for Version 7.2 | Creating and Formatting Text Columns]] <!--12.03.1-72--> |
| − | | [[Using Microsoft Project Alias Column Names in OnePager Text Column Headings for Version 7.2 | Using Microsoft Project Alias Column Names in OnePager Text Column Headings]] 12.06.1-72 | + | | [[Using Microsoft Project Alias Column Names in OnePager Text Column Headings for Version 7.2 | Using Microsoft Project Alias Column Names in OnePager Text Column Headings]] <!--12.06.1-72--> |
|- | |- | ||
| − | | [[Row and Swimlane Borders for Version 7.2 | Row and Swimlane Borders]] 12.04.1-72 | + | | [[Row and Swimlane Borders for Version 7.2 | Row and Swimlane Borders]] <!--12.04.1-72--> |
| − | | [[Automatically Hiding Empty Rows for OnePager for Version 7.2 | Automatically Hiding Empty Rows for OnePager]] 12.05.1-72 | + | | [[Automatically Hiding Empty Rows for OnePager for Version 7.2 | Automatically Hiding Empty Rows for OnePager]] <!--12.05.1-72--> |
|- | |- | ||
| − | | [[Snapshot-Dependent Text Columns for OnePager for Version 7.2 | Snapshot-Dependent Text Columns for OnePager]] 12.4.1-72 | + | | [[Snapshot-Dependent Text Columns for OnePager for Version 7.2 | Snapshot-Dependent Text Columns for OnePager]] <!--12.4.1-72--> |
| − | | [[Example of Function Option Use for OnePager for Version 7.2 | Example of Function Option Use]] 0.4.10.3-72 | + | | [[Example of Function Option Use for OnePager for Version 7.2 | Example of Function Option Use]] <!--0.4.10.3-72--> |
|} | |} | ||
Latest revision as of 18:45, 14 March 2024
Contents
- 1 Introduction
- 2 Overview
- 3 About Function Options Available in the Template/Chart Properties Form’s Rows/Swimlanes Tab
- 3.1 Row Sorting In Timeline Layout Charts
- 3.2 Swimlane Sorting in Gantt and Timeline Layout Charts
- 3.3 Establishing the Contents of Text Column Cells for Multi-Task Bar Rows
- 3.4 Using Functions in Conditional Formatting for Text Columns & Rows Form Rules
- 3.5 Using Functions in Conditional Formatting for Swimlanes
- 3.6 Using Function Options in the Swimlane Formatting – Left#n Form
- 3.7 Summary of Function Options Available in the Rows/Swimlanes Tab of the Template/Chart Properties Forms
- 3.8 Links to Detailed Information on Sorting of Rows and Swimlanes and Conditional Formatting Rules
- 4 Microsoft Project Source Plan and Timeline Chart for Use in Examples
- 5 Function Options for Text Columns, Rows, and Swimlanes in Conditional Formatting Rules
- 6 Interpretation of Function Options for Conditional Formatting for Text Columns & Rows and Swimlanes
- 6.1 All Values Function Option
- 6.2 At Least One Value Function Option
- 6.3 Average Function Option
- 6.4 First (Alpha) Function Option
- 6.5 Last (Alpha) Function Option
- 6.6 Maximum Function Option
- 6.7 Minimum Function Option
- 6.8 Median Function Option
- 6.9 Mode Function Option
- 6.10 No Value Function Option
- 6.11 Sum Function Option
- 7 Columns That Control Which Text Gets Displayed
- 8 Example Use of Function Options in Conditional Formatting for Text Columns & Rows
- 9 Example Use of Function Options in Conditional Formatting for Swimlanes
- 10 Example Use of Function Options in Template Properties and Chart Properties Form's Rows/Swimlanes Tab
- 11 Related Links
Introduction
Illustrations used in this article are from OnePager Pro using data from Microsoft Project but the features, functions, controls, and manual edits apply equally to other OnePager editions that import from data sources like Microsoft Excel, Microsoft Project Online, Microsoft Project Server, Microsoft Project for the Web, Smartsheet, Oracle Primavera P6, Planisware Enterprise, Asana, and Wrike.
Function options are used in OnePager when there is a need to aggregate values obtained from multiple task bars/milestone symbols in single and multiple rows of swimlanes and to do the same in similar situations with conditional formatting of text columns, rows, and swimlanes.
Additionally, function options are used in row and swimlane sorting where there are multiple task bars/milestone symbols in a single and multiple rows of swimlanes.
Conditional Formatting Rules using the Function feature and associated forms are provided in OnePager for two classes of objects:
- Text Columns and Rows
- Swimlanes
Overview
The purpose of this article is to introduce how function options are used to aggregate values in situations where multiple task bars/milestone symbols are present in rows/swimlanes and in conditional formatting rules for text columns and rows and conditional formatting rules for swimlanes. Additionally examples of how function options can be used are provided.
This article is divided into three parts. First, there is a sub-section about Function Options available to OnePager users covering their use for text columns, rows, and swimlanes. Second, there is a sub-section that provides examples of the use of Function Options specifically for conditional formatting rules for text columns & rows. And last, there is a sub-section devoted to examples of the use of Function Options for conditional formatting rules for swimlanes. Use the quick access links below to jump directly to these sub-sections:
About Function Options Available in the Template/Chart Properties Form’s Rows/Swimlanes Tab
Function options and their controls are provided in the OnePager Template Properties and Chart Properties form’s Rows/Swimlanes tab to support:
- 1) Row sorting in Timeline Layout charts,
- 2) Swimlane sorting in Gantt and Timeline Layout charts,
- 3) Establishing the contents of text column cells for multi-task bar/milestone symbol rows,
- 4) Using Functions in the Conditional Formatting for Text Columns & Rows form,
- 5) Using Functions in the Conditional Formatting for Swimlanes form, and
- 6) Using Functions in the Swimlane Formatting – Left#n form.
Each of these is discussed below.
Row Sorting In Timeline Layout Charts
OnePager supports the capability for you to sort rows in swimlanes for charts that are Gantt Layout or Timeline Layout. Swimlanes can consist of single or multiple rows of single or multiple task bars/milestone symbols each. The function option feature is enabled for Timeline Layout charts to assist you in aggregating all the source plan task data values in each row into a single value to use in row sorting. For Gantt Layout charts, each row only consists of one task bar/milestone symbol so the use of the function option controls would have no effect and thus is disabled. The Rows control group and Row Sorting control group in the Chart Properties form’s Row/Swimlanes tab are shown below:
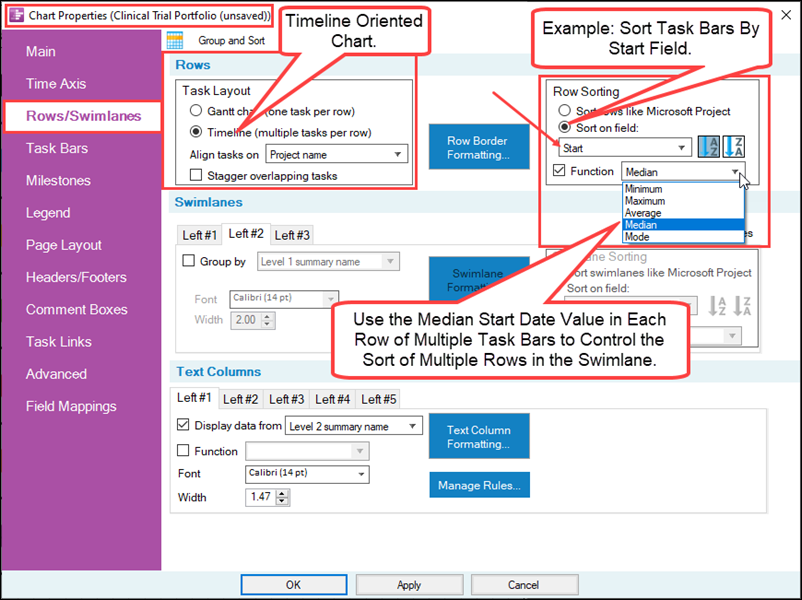
In the above Rows/Swimlanes tab’s Rows control group illustration, the Task Layout sub-control group specifies the Timeline Layout. Assume that the chart consists of multiple rows of multiple task bars/milestone symbols each and you need to sort rows in swimlane, say on Start date, from top to bottom in the swimlane. Since there are multiple Start dates associated with the set of task bar/milestone symbols in each of the several rows, you need a way to aggregate down to one value to control the sort. This is where the function option comes into play. As shown above, the Function options checkbox is checked ON because the chart is in the Timeline Layout and the Sort on field: radio button is selected enabling the Function options checkbox and the dropdown list.
As shown in the dropdown list, there are five (5) function options to select from and the Median is selected for the example. With this selection, OnePager looks at the Start dates for all task bars/milestone symbols in each row, computes the Median value, and uses that value to sort the rows in each swimlane. Prior to the OnePager Version 7.2 release, OnePager always aggregated the values into a single value for sorting rows but gave you no visibility into what it was doing.
Swimlane Sorting in Gantt and Timeline Layout Charts
It is often necessary to sort swimlanes in a chart based upon the value of some task bars/milestone symbol’s data field in the source plan. Function options are necessary where there are multiple task bars/milestone symbols in each swimlane, which is almost always the case. In this case, OnePager allows you to select a function option to aggregate the sort set of sort values found to one value per swimlane so that the swimlanes can be sorted in the chart. The Swimlanes control group and the Swimlane Sorting control group in the Chart Properties form’s Row/Swimlanes tab are shown below:
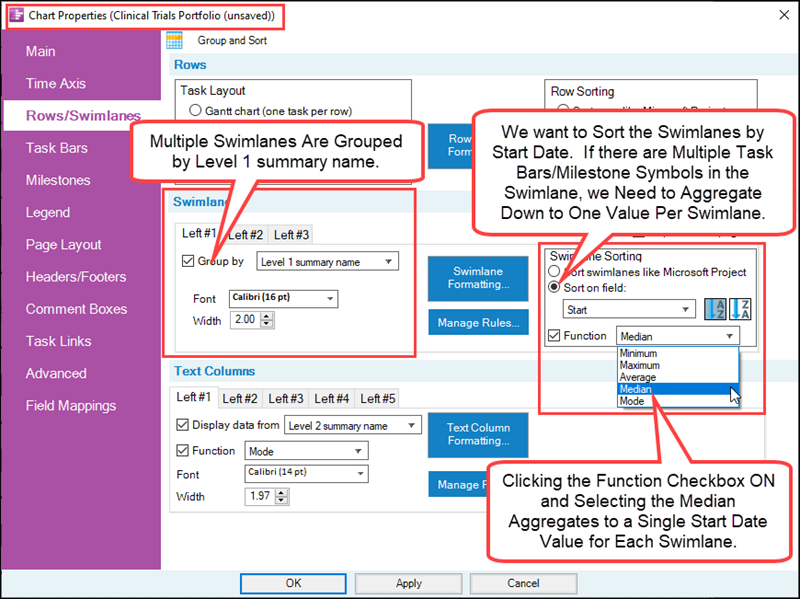
In the above Rows/Swimlanes tab’s Swimlanes control group, the Left#1 sub-tab has the Group by checkbox checked ON and the Level1 summary name selected for grouping swimlanes. Assume that the chart consists of swimlanes containing multiple task bars/milestone symbols and you need to sort swimlanes in the chart, say on Start date, from top to bottom in the chart. Since there are multiple Start dates associated with each task bar/milestone symbol in each swimlane, you need a way to aggregate down to one value to control the sort of the multiple swimlanes. Again, this is where the function option comes into play.
As shown above, the Function options checkbox is checked ON in the Swimlane Sorting sub-control group because the Sort on field: radio button is selected enabling the Function options checkbox and the dropdown list. In the dropdown list there are five (5) function options to select from and the Median is selected. With this selection, OnePager looks at the Start dates for all task bars/milestone symbols in each swimlane, computes the Median value, and uses that one value for each swimlane to sort the swimlanes in the chart. Prior to the 7.2 release, OnePager always aggregated the values into a single value for sorting swimlanes but gave you no visibility into what it was doing.
Establishing the Contents of Text Column Cells for Multi-Task Bar Rows
Situations can also arise where you need to determine a single value to populate one or more of the five (5) text column cell sets in a chart where there are multiple task bars/milestone symbols per row. To support this situation, OnePager has function options controls established for text column cells that are always available or enabled for both Gantt and Timeline Layout charts. The Text Columns control group in the Chart Properties form’s Row/Swimlanes tab is shown below:
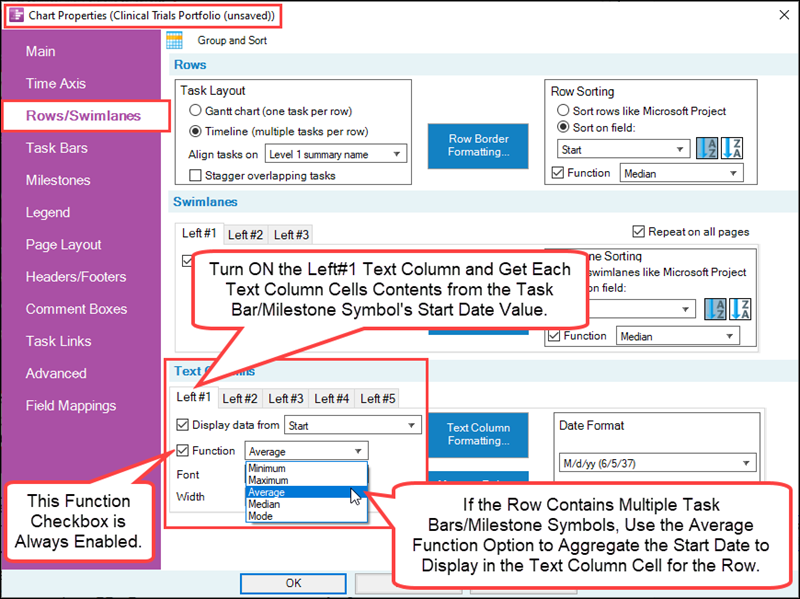
Above, in the Text Columns control group, the Left#1 text column is set up to Display data from each row’s task bars/milestone symbol’s Start date. If there are multiple task bars/milestone symbols in the row, OnePager needs a way to aggregate down to one value to display in the row’s text column cell. Once more, the function option is used. In the case above, OnePager uses the Average function option, examines all the Start dates for all task bars in the row, calculates the average value and displays that value in the row’s text column cell. Prior to the OnePager Version 7.2 release, OnePager always aggregated the values into a single value for displaying in each cell but gave you no visibility into what it was doing. The function that was used is called Legacy.
Establishing the Contents of Text Column Headings for Multi-Task Bar Rows
The Function options found in the Text Columns control group also adds information to the headings of the Text Columns. Consider the situation shown below:
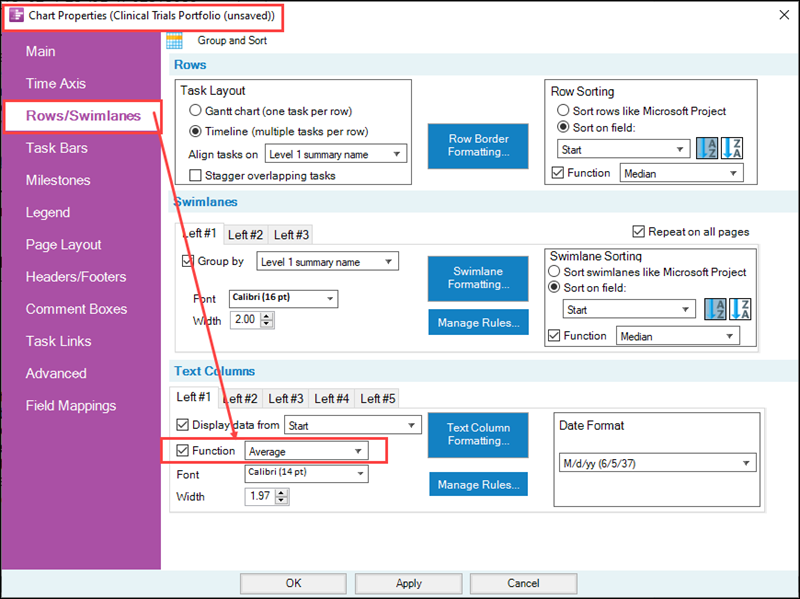
Since the text column cell values are being determined by the aggregation method you selected in the Function option dropdown list, OnePager augments the Text Column heading by adding a parenthetical adjective to describe the Function option used. In the case illustrated with the Chart Properties form shown above, the Left#1 Text Column is set to display Start date and the Function option selected is the Average. OnePager sets the Left#1 Text Column heading to Start and, because the Average Function option is selected, OnePager adds parenthetical text to the Left#1 Text Column heading indicating the Function option selected as shown below:

Using Functions in Conditional Formatting for Text Columns & Rows Form Rules
Function option controls are included in the Conditional Formatting for Text Columns & Rows form because, as noted above, source plans may create OnePager charts where there are multiple task bars per row and conditional formatting rule conditions (i.e., field, operator, function, and value columns) may need to aggregate multiple values to establish a single TRUE or FALSE result on a row by row basis. Once the rule condition is established, then the rule’s actions can be applied to the text columns and/or rows in the chart.
You can access the Conditional Formatting for Text Columns & Rows form by clicking the Manage Rules… button located in the Text Columns control group of the Rows/Swimlanes tab of either the Template Properties or Chart Properties form, shown below for the Chart Properties form:
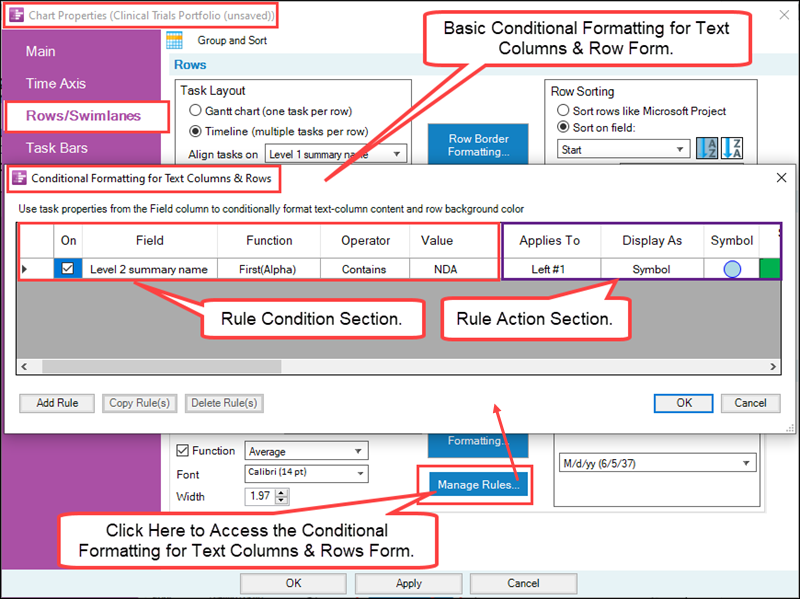
In the above form, the Function column has a dropdown whose contents are determined by the Field type specified in the Field column to the left. Similarly, the Operator column dropdown contains operator options associated with the Field type specified in the Field column. The Function dropdown includes additional options that were not applicable to the row-sorting or the contents of text column cell cases discussed above. This is because there are rule conditions (e.g. “at least one value in the row is 0”) that do not require aggregating all the values in the row into a single value.
Priority Application of Function Options with Text Columns
From the discussion in the previous sub-sections you may have noticed that there are two Function option controls available for Text Columns: (1) The Function option control in the Template Properties form or Chart Properties form’s Rows/Swimlanes tab in the Text Columns control group and (2) the Function dropdown in the Conditional Formatting for Text Columns & Rows form as shown below:
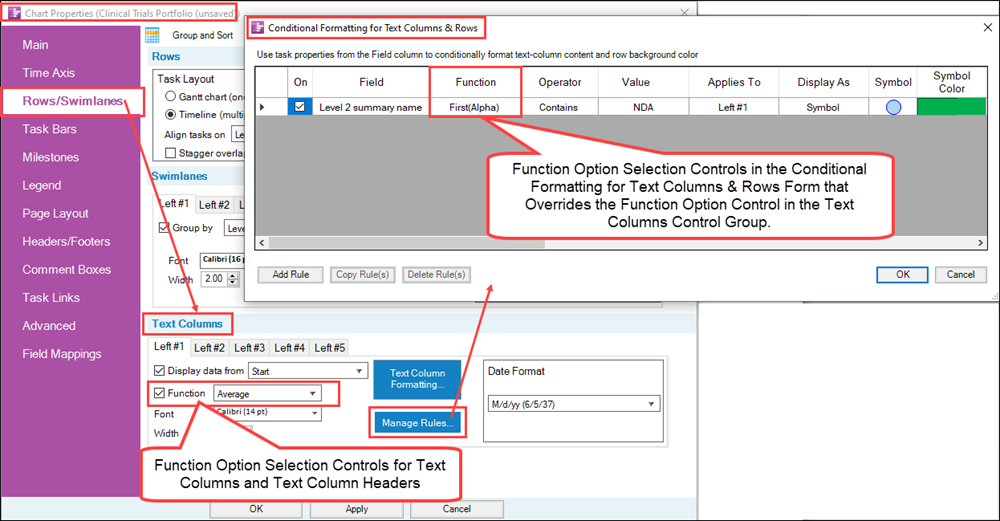
The Function option in the Text Columns control group is always ENABLED and is available to be turned ON at any time (clicking the Function checkbox ON in the Text Columns control group). As described above, when this Function option control is used, it serves to aggregate multiple task bar/milestone values into a single value for each row and inserts an adjective in the Text Column heading to clarify the Function option being used.
When you add one or more Conditional Formatting for Text Columns & Rows rules to control contents of the chart, you are essentially saying that you want the Conditional formatting rules to override the Function option selection established in the Text Columns control group whenever the row satisfies the Rule Condition.
However, OnePager retains the adjective inserted into the Text Column heading because it still applies to all rows that do not satisfy a Rule Condition. Should this convention pose any issues for your presentation, our recommendation is double-left click on the Text Column heading accessing the Enter text form and edit out the adjective. As an alternative you can also turn OFF the Function option checkbox in the Text Columns control group of the Rows/Swimlanes tab of the Chart Properties form.
Using Functions in Conditional Formatting for Swimlanes
You can access the Conditional Formatting for Swimlanes form by clicking the Manage Rules… button located in the Swimlanes control group of the Rows/Swimlanes tab of the Template Properties form or Chart Properties form as shown below:
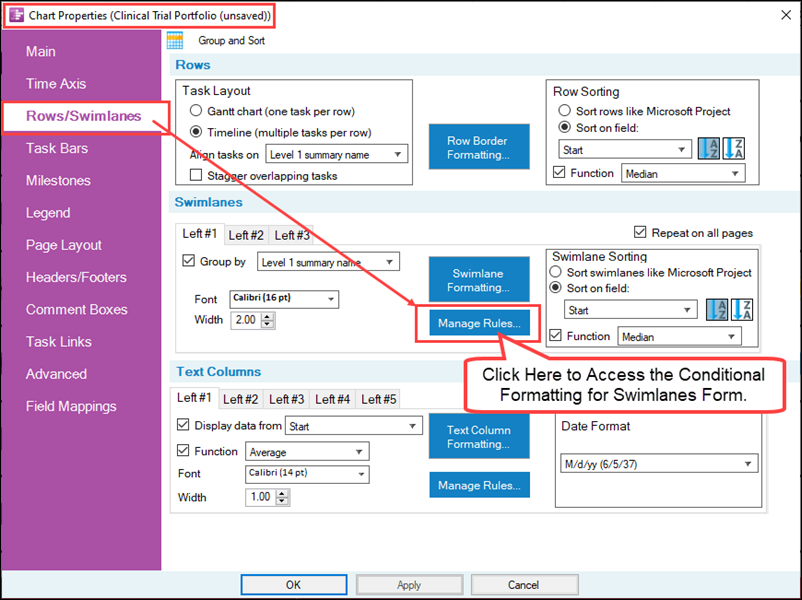
Function option controls are included in the Conditional Formatting for Swimlanes form because, as noted above, source plans almost always create OnePager charts where there are multiple task bars/milestone symbols per swimlane and conditional formatting rule conditions (i.e., field, operator, function, and value columns) need to aggregate multiple values to establish a single TRUE or FALSE result on each swimlane. Once the rule condition is established, the rule’s actions can be applied to the swimlane label cell and/or swimlanes in the chart.
Here is the Conditional Formatting for Swimlanes form:
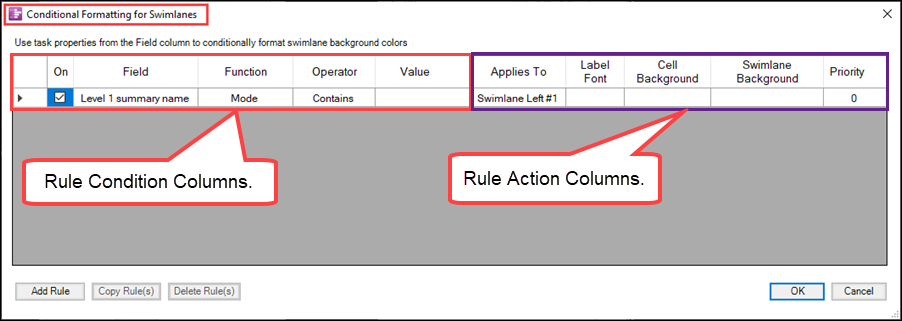
In the Conditional Formatting for Swimlanes form, shown above, you have the same Rule Condition Columns that are standard in all OnePager Conditional Formatting Rules forms. There are three Rule Action columns: (1) Label Font, (2) Swimlane Cell Background (color), and (3) Swimlane Background (color). The Priority column is provided, as in all Conditional Formatting Rules forms.
In the above form, the Function column has a dropdown whose contents are determined by the Field type specified in the Field column to the left. Similarly, the Operator column dropdown contains options associated with the Field type specified in the Field column. The Function dropdown includes additional options that are not applicable to swimlane sorting or to establishing the contents of swimlane name label cells. This is because there are rule conditions (e.g. “at least one value in the swimlane is 0”) that do not require aggregating all the values in a swimlane into a single value.
Using Function Options in the Swimlane Formatting – Left#n Form
As a final capability to complete the Function Option feature, you have the capability to use Function Options to establish the contents of Swimlane Label Cells. The control for this feature is located in the Swimlane Formatting – Left#n form shown below:
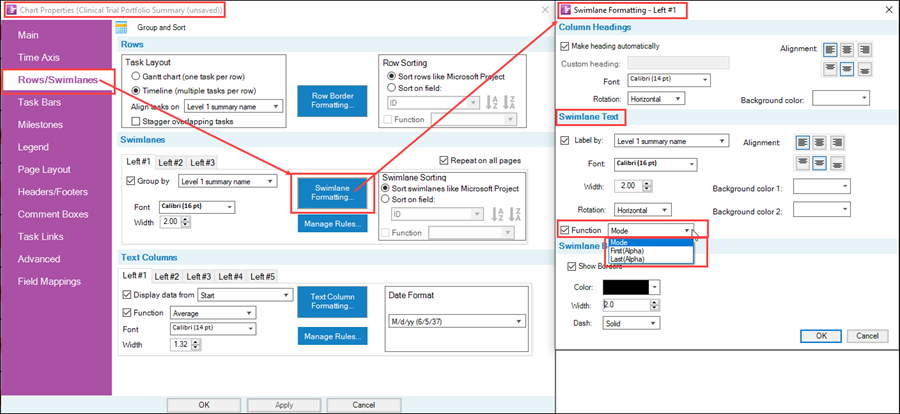
Like Swimlane Label cells OnePager provides the capability for you to use function options to establish the contents of the Swimlane Label Heading Cell. This feature gives you the capability to aggregate multiple possible swimlane label headings to a specific swimlane label heading appropriate for the swimlane’s cell contents. As with the other implementations of function options, the functions options provided in the dropdown list are dependent on the Field type contained in the Label by: dropdown in the above form.
Summary of Function Options Available in the Rows/Swimlanes Tab of the Template/Chart Properties Forms
The four (4) Function option dropdowns in the Rows/Swimlanes tab of the Chart Properties and Template Properties form have identical options depending on the Field type selected. These Function options are shown in the table below by Field type:
| Field Type | Average | First (Alpha) | Last (Alpha) | Maximum | Median | Minimum | Mode | Sum |
|---|---|---|---|---|---|---|---|---|
| Boolean | X | |||||||
| Date | X | X | X | X | X | |||
| Numeric | X | X | X | X | X | X | ||
| Text String | X | X | X |
An important note must be made here: Before any conditional formatting rules are analyzed and applied to text columns and/or rows, OnePager first performs any operations that are directed from controls in the Rows control group, Swimlanes control group, and Text Columns control group.
Links to Detailed Information on Sorting of Rows and Swimlanes and Conditional Formatting Rules
For more information on the Sorting Rows and Swimlanes and Conditional Formatting for Text Columns and Rows form and the Conditional Formatting for Swimlanes form, please use the links found in the table below:
The remainder of this article examines the use of function options for Conditional Formatting for Text Columns & Rows and for Conditional Formatting for Swimlanes.
Microsoft Project Source Plan and Timeline Chart for Use in Examples
As an example of how functions can be used to aggregate values for a text column cell and swimlane labels, suppose we look at part of a Microsoft Project source plan shown below:
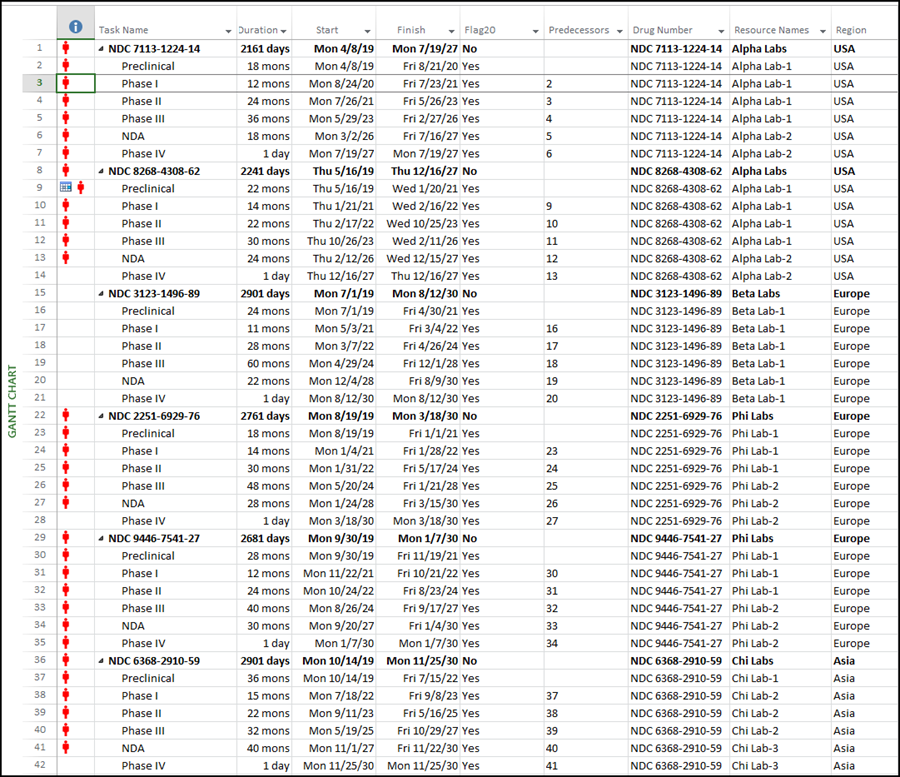
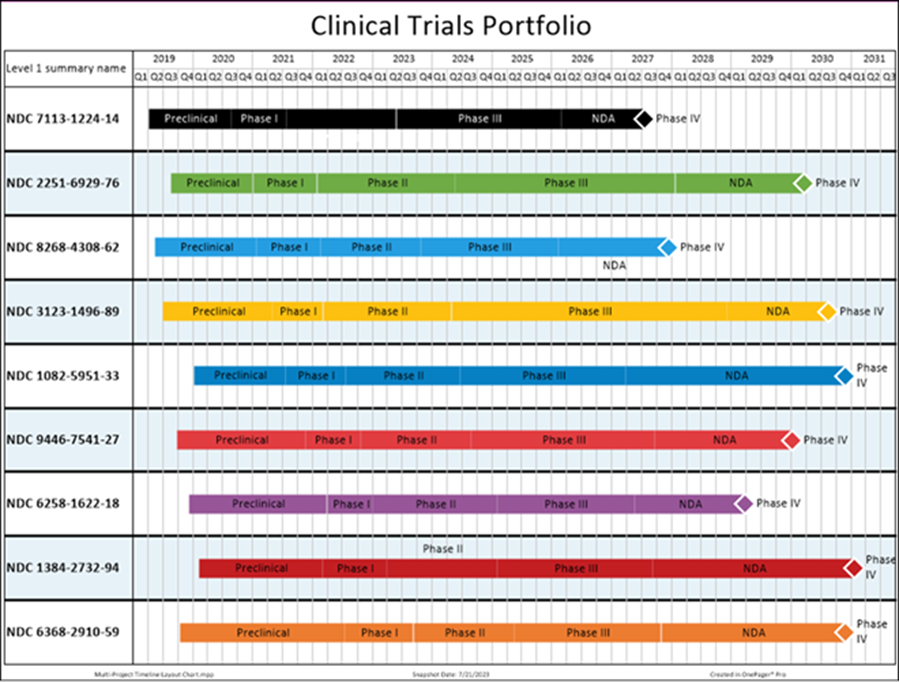
Using a Timeline Layout OnePager Template Properties form, we can create a Timeline Layout chart that looks like this:
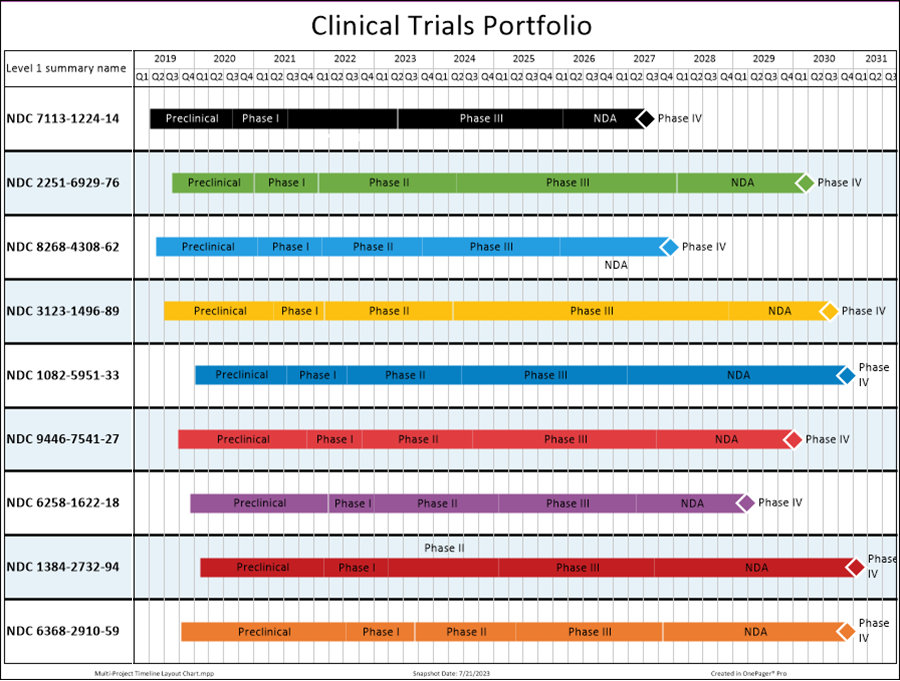
The above chart has multiple task bars and milestone symbols in a single row. The chart is organized such that the Clinical Trial Identifiers (Level 1 summary names) are used to group the rows into swimlanes. The Template Properties form (distributed with the OnePager product) used for the above chart is specifically tailored to display task bars in the Timeline Layout hence one row per swimlane is shown.
Task bars at the second level (Level 2 summary names) are finish to start so they appear in a solid row from left to right in each swimlane. The task names are unique within a swimlane but each Clinical Trial follows the same sequence of tasks.
The examples that follow use the Microsoft Project source plan and the above chart to illustrate how function options can be used in conditional formatting rules.
Function Options for Text Columns, Rows, and Swimlanes in Conditional Formatting Rules
Recall that the Conditional Formatting for Text Columns & Rows form and Conditional Formatting for Swimlanes forms can be accessed from either the Template Properties form to create conditional formatting rules for text columns, rows, and swimlanes before the chart is created or the Chart Properties form to create conditional formatting rules for text columns, rows, and swimlanes after the chart is created.
When the Conditional Formatting for Text Columns & Rows and Conditional Formatting for Swimlanes forms are accessed, there is a “starter” rule available in the grid that you can edit as required. More rules can be added as needed. The function options available for use in the rule depend on the Field type in the third column from the left in the form. The table below shows the valid function options available for each Field type available in OnePager:
| Field Type | All Values | At Least One Value | Average | First (Alpha) | Last (Alpha) | Maximum | Minimum | Mode | Medium | No Value | Sum |
|---|---|---|---|---|---|---|---|---|---|---|---|
| Boolean | X | X | X | X | X | ||||||
| Date | X | X | X | X | X | X | X | X | |||
| Numeric | X | X | X | X | X | X | X | X | |||
| Text String | X | X | X | X | X | X | X |
The X in the cells of the above table indicates that the Function option is available for that Field Type. Accordingly, the function options available appears in the dropdown list for the Function column in the form specific for the Field type of the Field column cell as illustrated below for a text string:
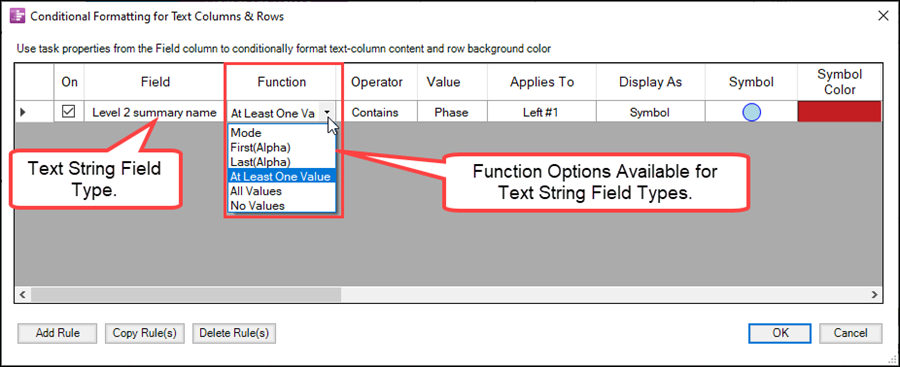
Interpretation of Function Options for Conditional Formatting for Text Columns & Rows and Swimlanes
The eleven (11) Function options available in the Conditional Formatting for Text Columns & Rows form and in the Conditional Formatting for Swimlanes form which are briefly discussed below.
All Values Function Option
The All Values function option means that the set of values from the task bars/milestone symbols in the row (swimlane) must ALL satisfy the condition defined by the Operator and Value cells to make the rule TRUE.
At Least One Value Function Option
At Least One Value means that at least one of the values from the task bars/milestone symbols in the row/swimlane must satisfy the condition defined by the Operator and Value cells in order to make the rule TRUE.
Average Function Option
The Average function combines all the values into a single average quantity that is then evaluated with Operator and Value cells to determine whether the rule is TRUE.
First (Alpha) Function Option
The First (Alpha) function finds the first string in a list of alphabetically-sorted string values in the row/swimlane and then evaluates it with Operator and Value cells to determine whether the rule is TRUE.
Last (Alpha) Function Option
The Last (Alpha) function finds the last string in a list of alphabetically-sorted string values in the row (swimlane) and then evaluates it with Operator and Value cells to determine whether the rule is TRUE.
Maximum Function Option
The Maximum function finds the maximum of the set of values in the row (swimlane) and then evaluates it with Operator and Value cells to determine whether the rule is TRUE.
Minimum Function Option
The Minimum function finds the minimum of the set of values in the row (swimlane) and then evaluates it with Operator and Value cells to determine whether the rule is TRUE.
Median Function Option
The Median function finds the median of the set of values in the row (swimlane) and then evaluates it with Operator and Value cells to determine whether the rule is TRUE.
Mode Function Option
The Mode function finds the mode of the set of values in the row (swimlane) and then evaluates it with Operator and Value cells to determine whether the rule is TRUE.
No Value Function Option
No Values means that none of the values in the row (swimlane) satisfy the condition defined by the Operator and Value cells in order for the rule to be TRUE.
Sum Function Option
The Sum function adds all the values in the row (swimlane) to form a quantity that is then evaluated with Operator and Value cells to determine whether the rule is TRUE.
Columns That Control Which Text Gets Displayed
The Custom Text and Which text columns are provided only in the Conditional Formatting for Text Columns & Rows form and are enabled only when Display As is set to Text.
Custom Text Column
You can create a rule that causes special text to appear in a Text Column cell when the rule’s condition evaluates to TRUE. For example, you could put the words “Really, Really LATE!!” into a Text Column cell and condition it on all of the task bars in that row having the Status field equal to Late. To do that, just set the Which text column to Custom Text and then enter “Really, Really LATE!!” into the Custom Text cell in the rule grid. Notice that the Custom Text cell for a rule is disabled unless you choose Custom Text in the rule’s Which text column.
Which Text Column
The Which text column determines what text is displayed in the text column cell when a rule’s condition is TRUE and when Display As is set to Text. There are either two or three choices for the cells in this column:
- There is always a choice to display the data specified in Template Properties or Chart Properties form’s Rows/Swimlanes tab’s Text Columns control group. This choice simply displays the data that would be there if the rule did not exist. You would then need to make either the font or the cell’s background color change when the rule’s condition is TRUE.
- There is always a second choice to display the literal text that you enter directly into the Custom Text cell in the rule. This special text appears only when the rule’s condition evaluates to TRUE. If the rule’s condition evaluates to FALSE, what appears is the data specified in Template Properties or Chart Properties form’s Rows/Swimlanes tab’s Text Columns control group.
- Finally, if the Function choice of a rule produces a single output value, there can be a choice to display that output value. This option is not available if the Function choice is No Value, All Values, or At Least One Value. This option is not be available if the Function choice of the rule is the same as the Function choice in Template Properties or Chart Properties form’s Rows/Swimlanes tab’s Text Columns control group.
The example below shows how the chart appears when the first choice is made. What the user wants to do in this example is to highlight the Left#1 text column’s text string and background color if the modal value for the Start date for any task bar/milestone symbol in the rows has a modal Start date greater than January 1, 2026.
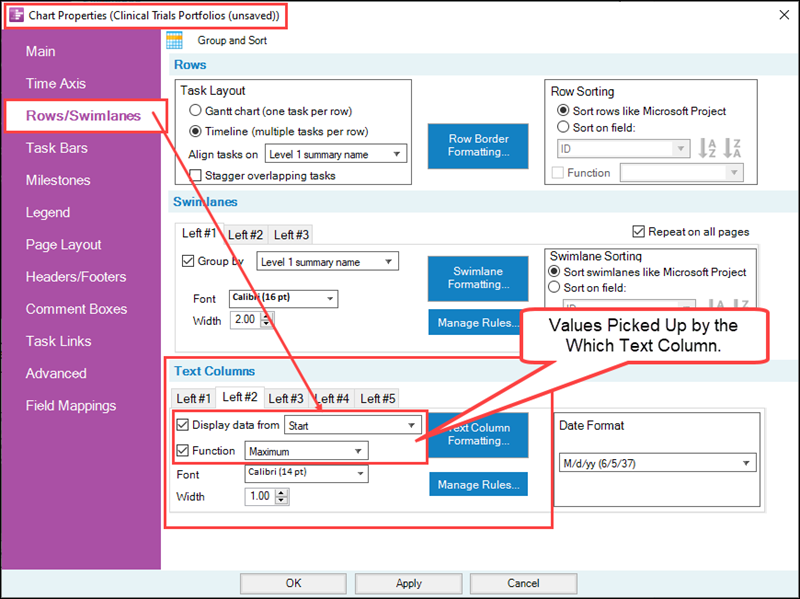

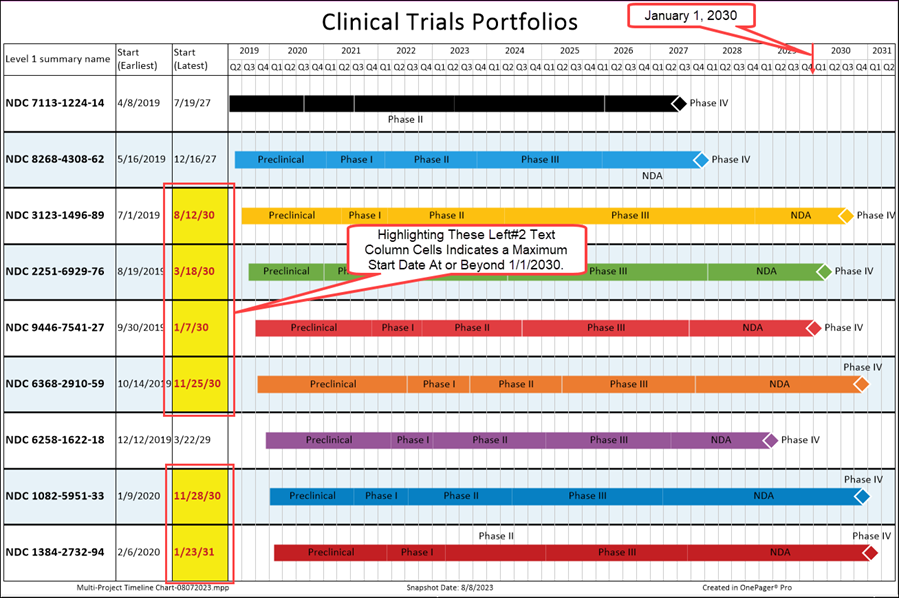
The combination of the use of the Maximum Function Option for the Left#2 Text Column for the Start date field and the Conditional Formatting for Text Columns & Rows form rule is to highlight those Text Column cells where the maximum start date is beyond January 1, 2030. When these conditions are me, the Conditional Formatting for Text Columns & Rows rule changes the text font and the background color for the appropriate Text Column cells as shown below:
Example Use of Function Options in Conditional Formatting for Text Columns & Rows
Using the Microsoft Project source plan shown above and the resulting OnePager Timeline Layout chart, we can construct examples to illustrate the use of two (2) function options with the Conditional Formatting for Text Columns & Rows form.
Function Option Example (1): At Least One Value
The example below uses the At Lease One Value function option for the example. At Least One Value means that at least one of the values from the task bars/milestone symbols in the row/swimlane must satisfy the condition defined by the Operator and Value cells in order to make the rule TRUE.
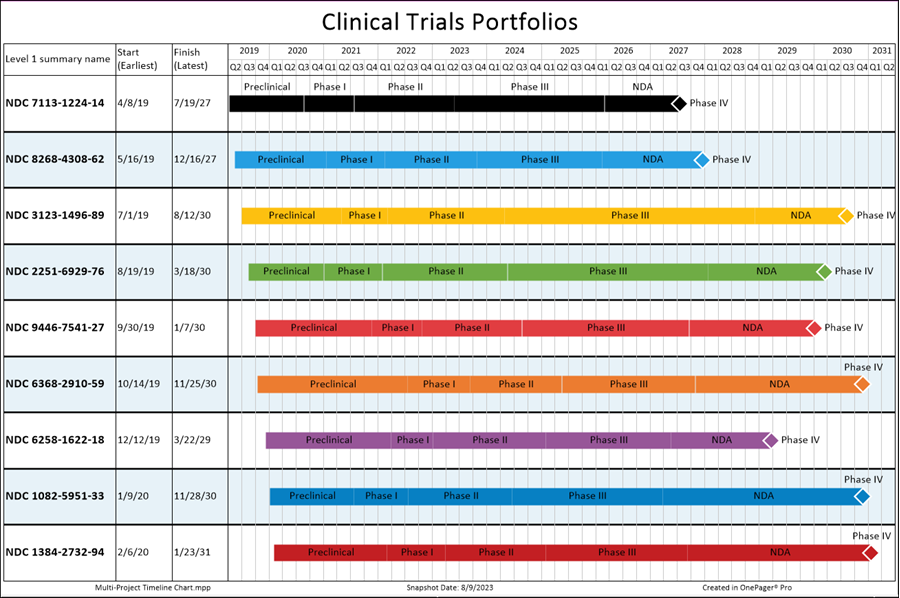
The example uses the Clinical Trials Portfolios source plan use previously in this article where we’ve added two text columns mapped to Start (Minimum) and Finish (Maximum) respectively for Text Columns Left#1 and Left#2.
To set up the example, the Chart Properties forms’ Rows/Swimlanes tabs are shown below:
For the Left#1 Text Column’s setting, the Rows/Swimlanes tab looks like this:
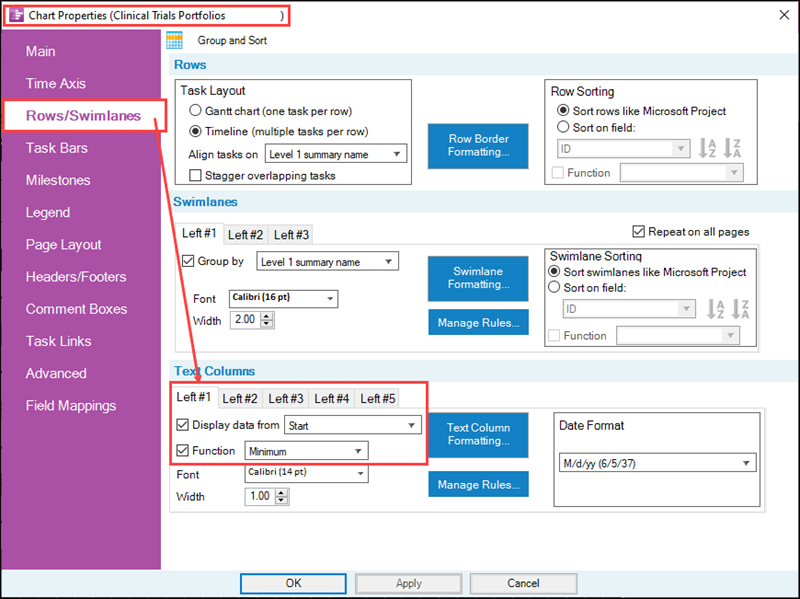
Please note a few of the settings in the Chart Properties form’s Rows/Swimlanes tab above:
- 1) In the Rows control group, the Task Layout’s sub-control group has the Timeline radio button selected.
- 2) In the Swimlanes control group, the Left#1 sub-tab has the Grouped by checkbox checked ON and set to Level 1 summary name corresponding to the Clinical Trial Identifier.
- 3) In the Text Columns control group, the Left#1 sub-tab has the Display data from checkbox checked ON and set to Start.
- 4) The Function option selected in the Text Columns control group is Minimum.
For the Left#2 Text Column’s setting, the Rows/Swimlanes tab looks like this:
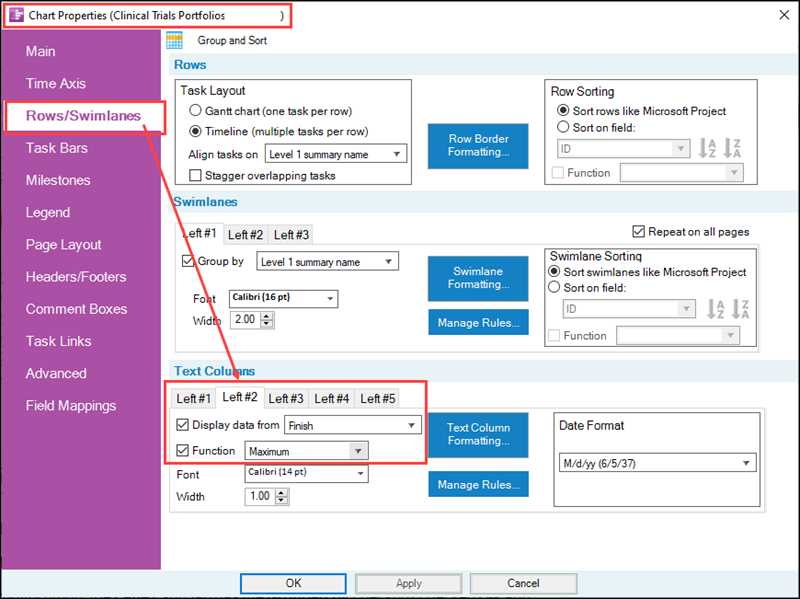
Again, note the settings in the Chart Properties form’s Rows/Swimlanes tab above:
- 1) In the Rows control group, the Task Layout’s sub-control group has the Timeline radio button selected.
- 2) In the Swimlanes control group, the Left#1 sub-tab has the Grouped by checkbox checked ON and set to Level 1 summary name corresponding to the Clinical Trial Identifier.
- 3) In the Text Columns control group, the Left#2 sub-tab has the Display data from checkbox checked ON and set to Finish.
- 4) The Function option selected in the Text Columns control group is Maximum.
Before applying the Conditional Formatting for Text Columns & Rows rule to the chart, the original chart looks like this:
When the settings described above are applied to the original chart from the Rows/Swimlanes tab alone, the changed chart looks like this:
Clicking the Manage Rules… button in the Text Columns control group accesses the Conditional Formatting for Text Columns & Rows form. Using the form, we can create rules to change the contents of the Left#1 and Left#2 text column cells as shown below:

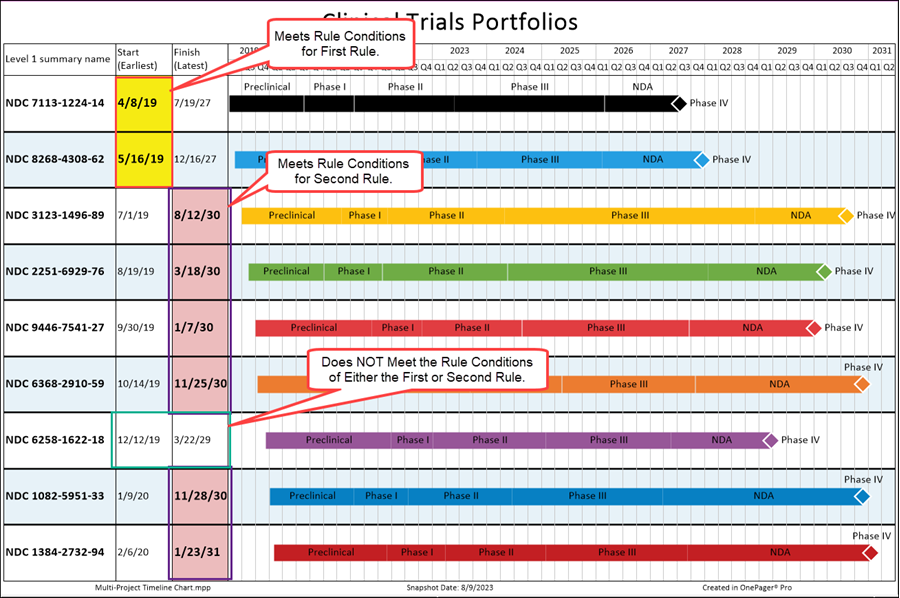
The intent of these two Conditional Formatting for Text Columns & Rows rules is to highlight the text and text column background colors for those text column cells having At Lease One Value for Start less that June 1, 2019 and At Least One Value for Finish greater than June 15, 2029.
The controls in the Rows/Swimlanes tabs in the Text Columns control group already set the Start (Minimum) and Finish (Maximum) for each cell as shown above. The Conditional Formatting for Text Columns & Rows rules use these data to determine the application of the Action Conditions on the individual two sets of Text Column cells.
When the Conditional Formatting for Text Columns & Rows rule is applied to the above chart, the results look like this:
Function Option Example (2): Mode
The example below uses the Mode function option for the example below. The Mode function finds the mode of the set of values in the row (swimlane) and then evaluates it with Operator and Value cells to determine whether the rule is TRUE.
The remainder of the set up for this example for the Rows/Swimlanes tab’s Text Columns control group is the same as the previous example except the Left#2 Text Column’s Display data from checkbox is checked OFF. Given this slight change, the chart looks like this:
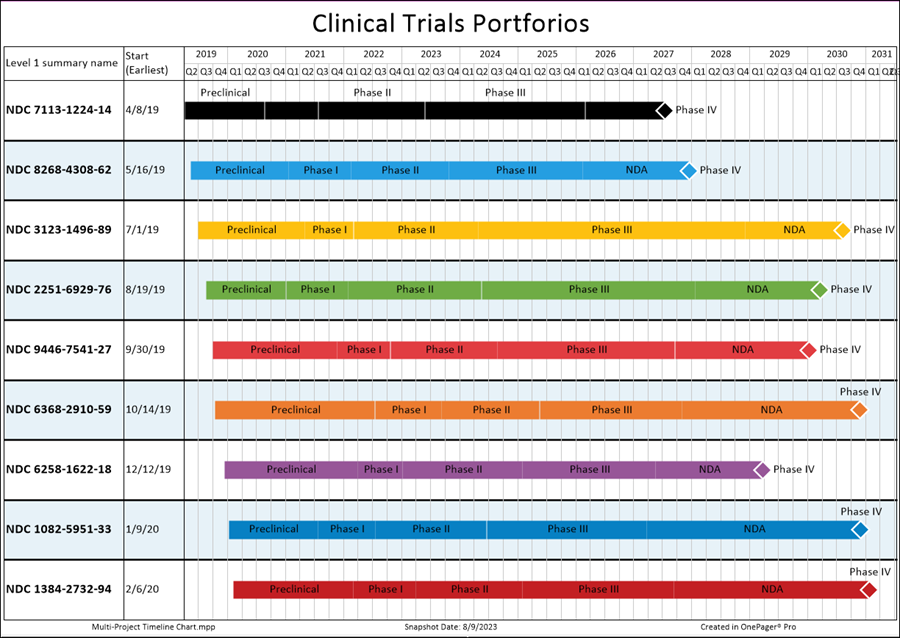
Clicking the Manage Rules… button accesses the Conditional Formatting for Text Columns & Rows form with a rule to change the contents of the Left#1 text column cell as shown below:
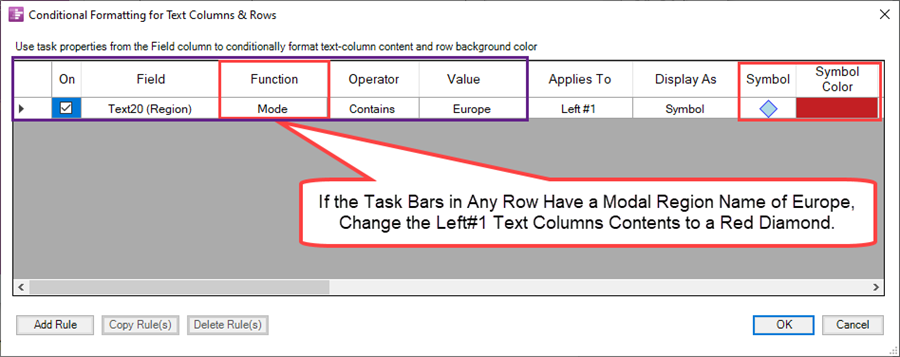
The purpose of the above Conditional Formatting for Text Columns & Rows rule is to highlight those Portforlio efforts that are taking place in the European Region with a Red Diamond symbol.
When the Conditional Formatting for Text Columns & Rows rule is applied to the above chart, the results look like this:
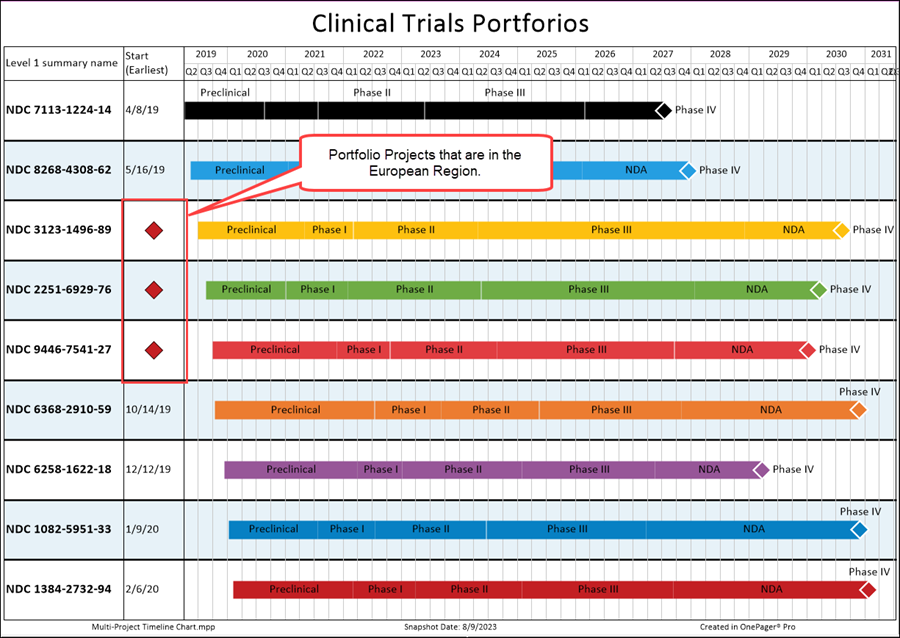
Conditional Formatting for Text Columns & Row rules can be used in this manner to highlight text columns and rows with color, text comments, dynamic symbols, and/or emojis to direct the attention of your audience to specific issues.
Example Use of Function Options in Conditional Formatting for Swimlanes
Using the Microsoft Project source plan shown above and the resulting OnePager Timeline Layout chart, we can construct examples to illustrate the use of two (2) function options with the Conditional Formatting for Swimlanes form.
Function Option Example (1): All Values
The example below uses the All Values function option. The All Values function option means that the set of values from all task bars/milestone symbols in the row (swimlane) must ALL satisfy the conditional formatting rule in order to make the condition formatting rule TRUE.
To set up the example, the Chart Properties form’s Rows/Swimlanes tab is shown below:
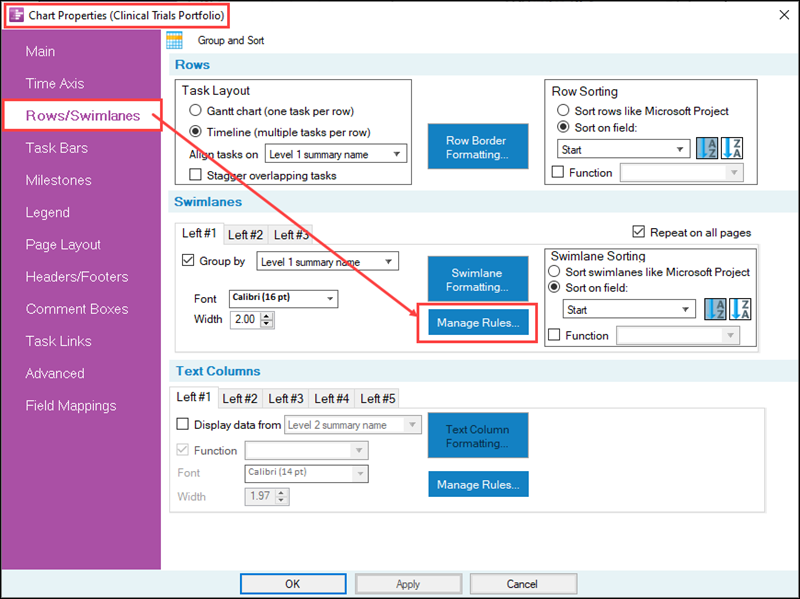
Before going further, please note a few of the settings in the Chart Properties form’s Rows/Swimlanes tab above:
- 1) In the Rows control group, the Task Layout’s sub-control group has the Timeline radio button selected.
- 2) In the Swimlanes control group, the Left#1 sub-tab has the Grouped by checkbox checked ON and set to Level 1 summary name corresponding to the Clinical Trial Identifier.
- 3) In the Text Columns control group, the Left#1 sub-tab has the Display data from checkbox checked OFF.
Before applying the Conditional Formatting for Swimlanes rule to the chart, the chart looks like this:

Clicking the Manage Rules… button in the Swimlanes control group accesses the Conditional Formatting for Swimlanes form. Using the form, we can create rules to change the look of the Left#1 swimlane level cells as shown below:
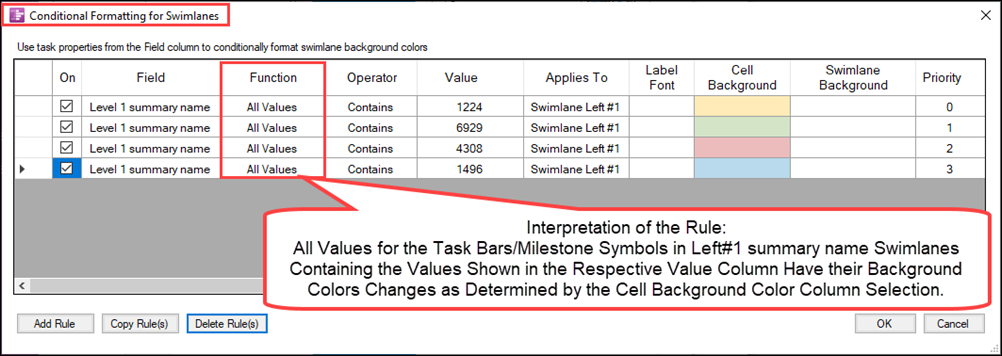
The four conditional formatting swimlane rules look for the text string values shown in the Value column and when found, change the Left#1 swimlane cell’s background color to the color selected in the Cell Background column as shown below:
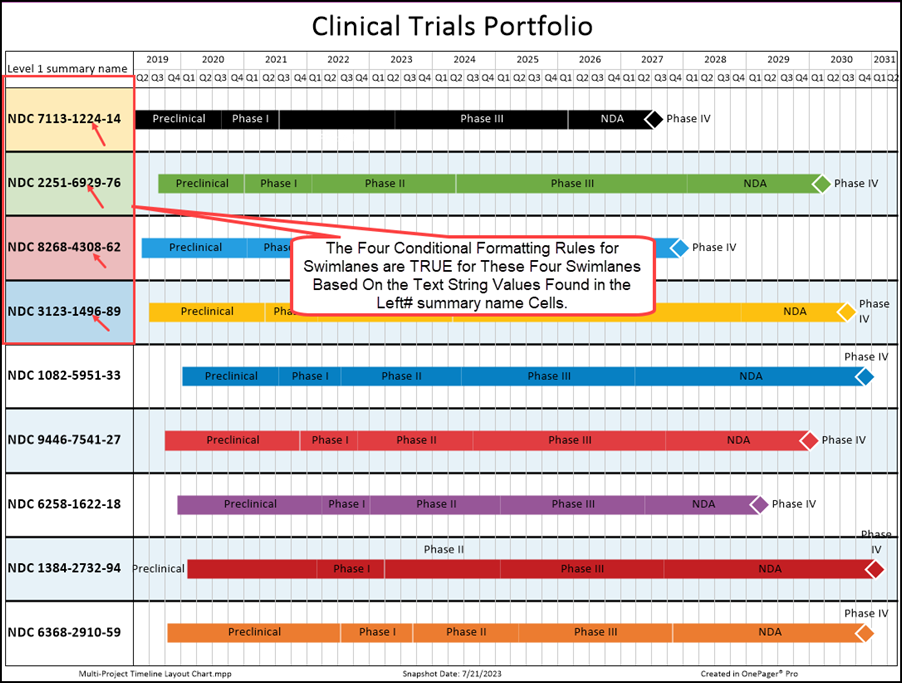
In the above chart all the Conditional Formatting Swimlane rules are TRUE for the top four swimlanes so the Left#1 swimlane name cells have their Cell Background colors changed to the values selected in the Conditional Formatting for Swimlanes form shown above.
Function Option Example (2): At Least One Value
The example below uses the At Least One Value function option. At Least One Value means that at least one of the set of values from all task bars/milestone symbols in the swimlane must satisfy the conditional formatting rule in order to make the condition formatting rule TRUE.
The remainder of the set up for this example is the same as the previous example.
Clicking the Manage Rules… button accesses the Conditional Formatting for Swimlanes form. Using the Conditional Formatting for Swimlanes form from the previous example, a fifth conditional formatting rule for swimlanes is added using the At Least One Value Function option as shown below:
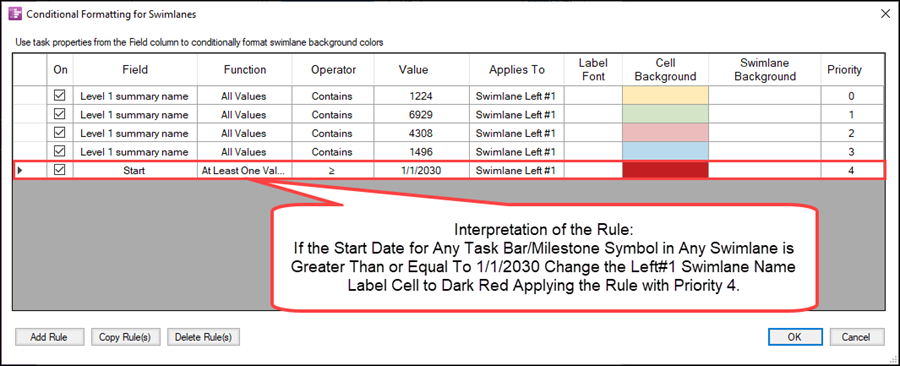
The added fifth rule states that if the Start date for any task bar/milestone symbol in the chart has a value greater than or equal to January 1, 2030, change the Left#1 swimlane name label cell to dark red with Priority 4. When the Conditional Formatting for Swimlanes rule is applied to the above chart, the results look like this:
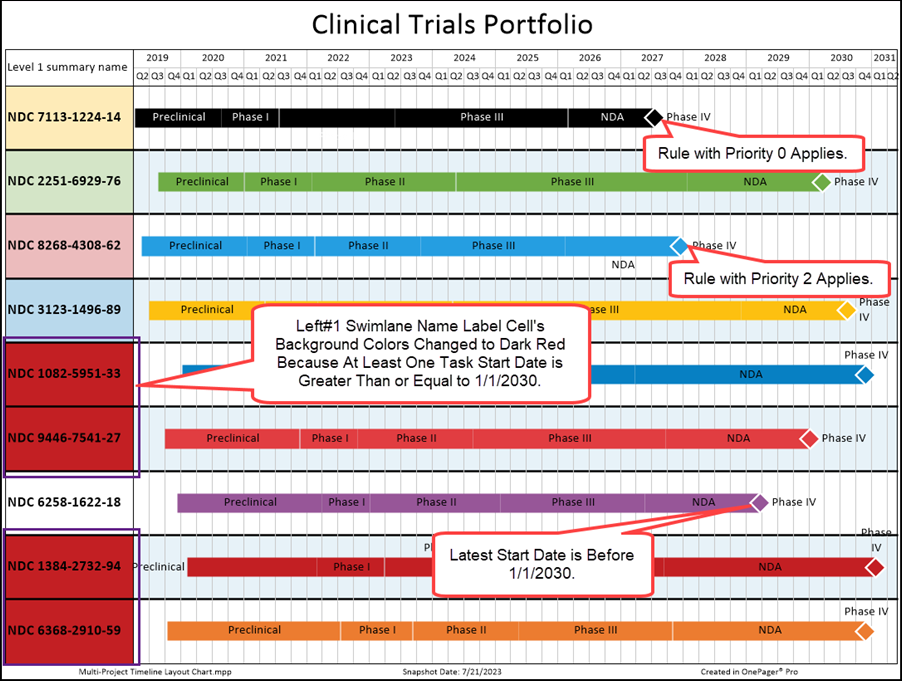
In the above chart, the top four swimlanes remain unchanged. With the addition of the fifth conditional formatting for swimlanes rule, because the preceding four rule’s priority are higher than the fifth rule we added, the remain swimlanes below the top four are subject to the fifth rule because none of their Left#1 summary name’s contain the values specified in the top four rules stated in the Conditional Formatting for Swimlanes form. The swimlane label NDC-6258-1622-18 is unchanged because the fifth rule is FALSE for that swimlane because there is no Start date in that swimlane where a task bar/milestone symbol has a Start date greater than or equal to January 1, 2030.
Conditional Formatting for Swimlane rules can be used in this manner to highlight swimlane name label cells with color to direct the attention of your audience to specific issues.
Example Use of Function Options in Template Properties and Chart Properties Form's Rows/Swimlanes Tab
In support of creating timeline charts and in other innovative uses, OnePager provides options to use functions outside of conditional formatting rules for editing in rows and swimlanes as discussed in this article. As an example of the use of the Sum function option please see the article at the link below:
| Example of Function Option Use |
Related Links
| Statistical Columns |
(12.07.1-72)