OnePager's Ribbon Tool Bar Page Layout Tab for Version 7.2
Contents
Overview
Illustrations used or referenced in this article are from OnePager Pro using data from Microsoft Project but the features, function, controls, and manual edits apply equally to other OnePager editions that import from data sources like Microsoft Excel, Oracle Primavera P6, Smartsheet, Planisware Enterprise, Project for the Web, Asana, and Wrike.
OnePager's Ribbon Tool Bar Page Layout Tab
The OnePager Ribbon Tool Bar Page Layout tab is shown in detail below:

The Page Layout tab contains four (4) sub-sections and is used to provide control over output media produced by OnePager. These four (4) sub-sections are described below:
Page Layout Tab – View Modes Sub-Section
There are four (4) button controls in the View Modes sub-section that control the viewing modes available in the OnePager Chart Editor. The default mode is Normal as shown in the illustration above which is the viewing mode established when the Chart Editor is opened. Each of the three (3) remaining View Modes is discussed below.
Page Break Button
When in the Page Break button is clicked, the Chart Editor displays the location of horizontal and vertical page breaks currently inserted into the chart. If no page breaks are presently inserted into the chart, the chart is updated with a water mark indicating that the entire chart is Page 1.
For illustration, suppose the chart has a vertical and horizontal page break inserted making the chart in output media contain four (4) pages. When the Page Break button is clicked, the Chart Editor displays the locations of the page breaks and the water marks indicating the page number in the appropriate quadrants as shown here:
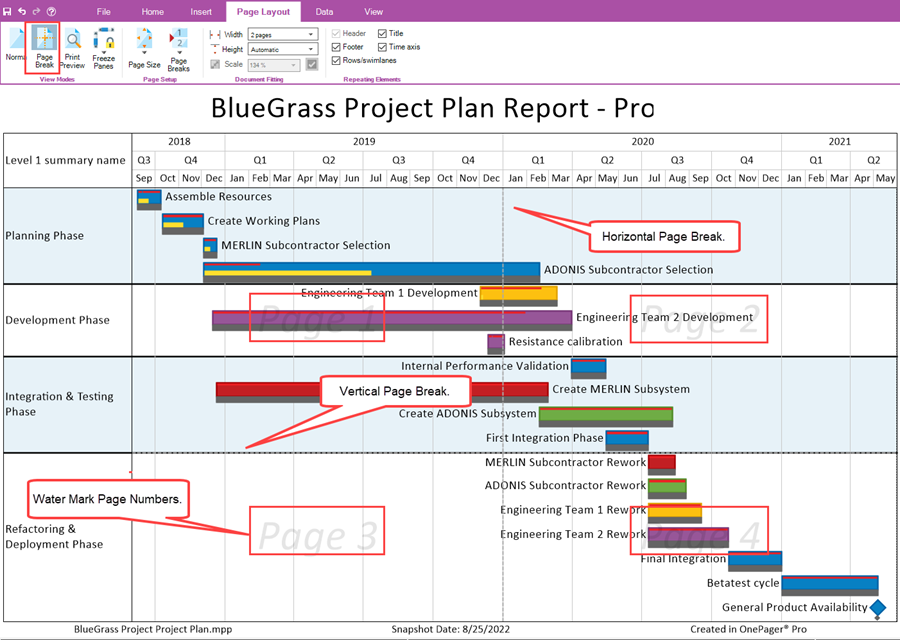
Making any changes in the Document Fitting sub-section updates the Page Break View Mode in the Chart Editor.
Print Preview Button
The Print Preview Button, when clicked, changes the Chart Editor’s View Mode, which may be the Normal View Mode or the Page Break View Mode, to that of the Print Preview View Mode as shown below in a transition from the Page Break View Mode with four (4) pages:
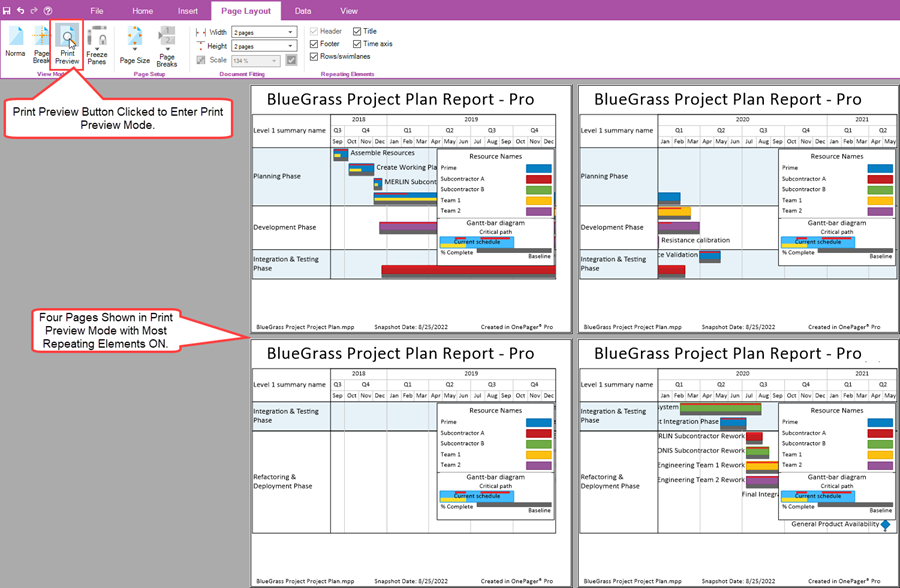
In the Print Preview View Mode making any changes using any of the controls in the Page Layout tab may change the chart in the Print Preview View Mode and potentially in the Chart Editor.
To return to the Chart Editor’s Normal View Mode, click the Home tab on the OnePager Ribbon Tool Bar.
Freeze Pages Dropdown
The Freeze Pages Dropdown is enabled in the Normal View Mode and the Print Preview View Mode. Clicking the Freeze Pages dropdown accesses the dropdown list of five (5) commands shown here:

The purpose of the Freeze Pages View Mode is to give you the capability for charts that are large in terms of horizontal and/or vertical extent to keep either or both the row and swimlane labels and/or the top/bottom time axis level cells in the Chart Editor’s viewing area when scrolling left and right or up and down. The Freeze Pages settings are carried forward to any output media produced.
The following commands are available in the Freeze Pages View Mode dropdown list:
- Freeze none – The Freeze none command is enabled whenever either the time axis or rows and swimlane labels Freeze commends are displayed in the Chart Editor. Clicking the Freeze none command essentially removes all Freeze options currently shown in the Chart Editor.
- Freeze all – This command turns ON both the Freeze top/bottom time axis and Freeze row and swimlane labels commands and makes them always shown in the Chart Editor.
- Freeze top time axis – The Freeze top time axis command freezes the top time axis level cells in the Chart Editor such that the top time axis is always visible at the top of the chart when vertical scrolling is done. If the bottom time axis is present in the Chart Editor it is not frozen.
- Freeze row and swimlane labels – The Freeze row and swimlane labels freezes any showing row and/or swimlane labels in the Chart Editor such that the row and/or swimlane labels are always visible on the left side of the chart when horizontal scrolling is done.
- Freeze bottom time axis - The Freeze bottom time axis command freezes the bottom time axis level cells in the Chart Editor such that the bottom time axis is always visible at the bottom of the chart when vertical scrolling is done. If the top time axis is present in the Chart Editor it is not frozen.
The Freeze Page View Mode dropdown commands are enabled only when the corresponding component is showing in the Chart Editor in Normal View Mode.
Page Layout Tab – Page Setup Sub-Section
The Page Setup sub-section contains two (2) dropdown lists of command for establishing the page size on output media and for inserting manual horizontal and vertical page breaks into the Chart Editor in Page Break View Mode to establish the number of pages for output media. The Page Setup sub-section and its dropdown commands are shown below:

Page Size Dropdown
The Page Size dropdown is a list of available page sizes based upon the printer capabilities connected to your computer. A typical Page Size dropdown list looks like this:
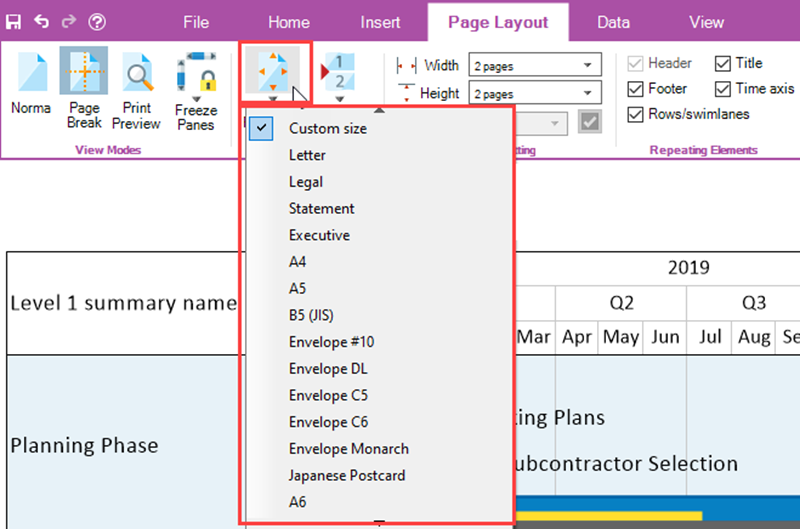
The option in the Page Size dropdown list with the checkbox checked is the current page size being used. Changing the page size causes OnePager to adjust the number of pages based upon the current output media being used.
Page Breaks Dropdown
The Page Breaks Dropdown is a list of four (4) commands that provide you with the capability to manually insert horizontal and/or vertical page breaks into the graph. The Page Breaks dropdown list is enabled in the Normal and Page Break View Modes.
Clicking the Page Breaks dropdown list accesses the commands shown in the illustration below:

Inserting a manual page break requires three (3) steps.
- First, access the Page Breaks dropdown list and select either the Insert vertical page break option or Insert horizontal page break option.
- Next, the dropdown list closes and you can move the mouse cursor into the graph area where the cursor becomes a plus sign and a dotted line appears in the graph.
- If the Insert vertical page break option is selected, the dotted line is horizontal.
- If the Insert horizontal page break option is selected, the dotted line is vertical.
- For the last step, position the mouse cursor where you want the page break placed and left-click the mouse. When you do this the inserted manual page break snaps into a position depending on its type.
- Vertical page breaks snap between the closes two rows.
- Horizontal page breaks snap between the two closest lower level time axis cells.
The Page Breaks dropdown list contains five (5) commands as follow:
- Insert vertical page break – Inserts a vertical page break that divides the chart into multiple horizontal sections.
- Insert horizontal page break - Inserts a horizontal page break that divides the chart into multiple vertical sections.
- Remove all inserted page breaks – This option removes all manually inserted vertical and/or horizontal page breaks. Automatic page breaks inserted by OnePager remain.
- Remove all page breaks – This option removes all manually inserted and automatically inserted page breaks from the graph.
Page Layout Tab – Document Fitting Sub-Section
The Document Fitting sub-section contains two (2) dropdown lists and a window for showing the scale factor for the chart in output media. The Document Fitting sub-section is shown here:

Width Dropdown
The Width dropdown list provides you with the capability to let OnePager determine where the vertical page breaks are inserted to meet the page number setting selected. The Width dropdown list is shown below:

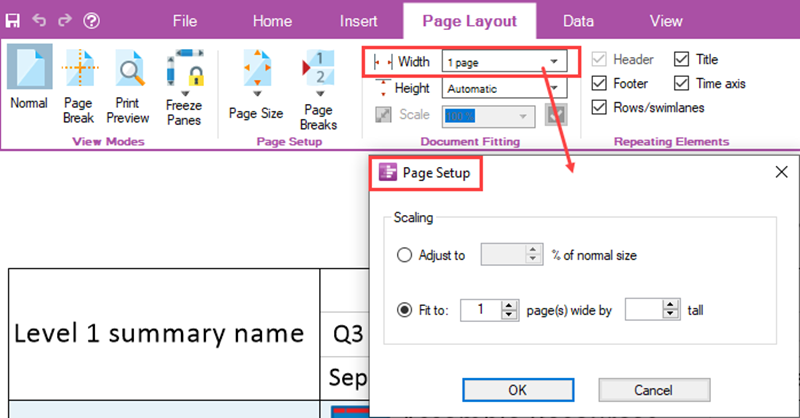
The Automatic option tells OnePager to determine the number of pages in width based on the size of the chart and the selected output media. There are additional selections that can be used from one (1) page through nine (9) pages. Clicking the More choices options accesses the Page Setup form which provides additional controls over the way the chart looks in output media. The Page Setup form is shown below:
Height Dropdown
The Height dropdown list provides you with the capability to let OnePager determine where the horizontal page breaks are inserted to meet the page number setting selected. The Height dropdown list is shown below:

The Automatic option tells OnePager to determine the number of pages in width based on the size of the chart and the selected output media. There are additional selections that can be used from one page through nine pages. Clicking the More choices options accesses the Page Setup form which provides additional controls over the way the chart looks in selected output media. The Page Setup form is shown in the previous illustration above.
Scale Window
When you select Automatic for both the width and height settings, the Scale window is enabled giving you choices for scale factors as shown below:

Increasing the Scale factor enlarges the size of the chart on the output media while decreasing the Scale factor decreases the size of the chart on the output media. Using these controls you can tailor the presentation of the chart on the output media to include printed pages and copied pages suitable for pasting into a Microsoft PowerPoint presentation. You also have the option to enter a value into the window. When this is done, the checkbox to the right of the window is enabled. When the final value is set, click on the checkbox and that typed value becomes the scale factor.
Page Layout Tab – Repeating Elements Sub-Section
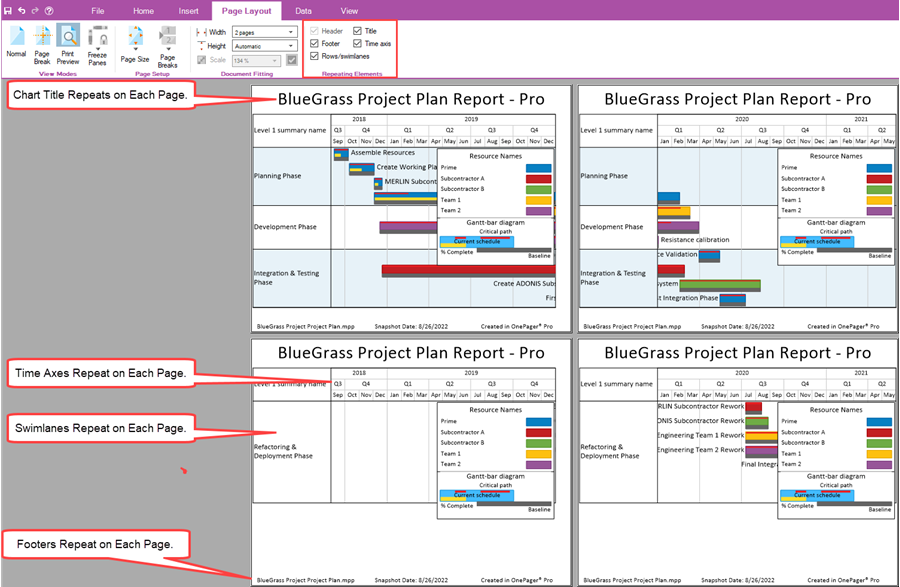
The Repeating Elements sub-section consists of five (5) checkboxes each turning ON or OFF elements of the chart that appear or are hidden on every page of multi-page output media. The Repeating Elements sub-section is shown below:

The five (5) checkboxes shown in the illustration above are enabled when the corresponding chart element is present in the chart. For example, the Header checkbox is disabled because in the chart shown below does not have Headers defined in either the Template Properties or Chart Properties form’s Headers/Footers tab. A four (4) page chart with the above four (4) Repeating Elements turned ON looks like this:
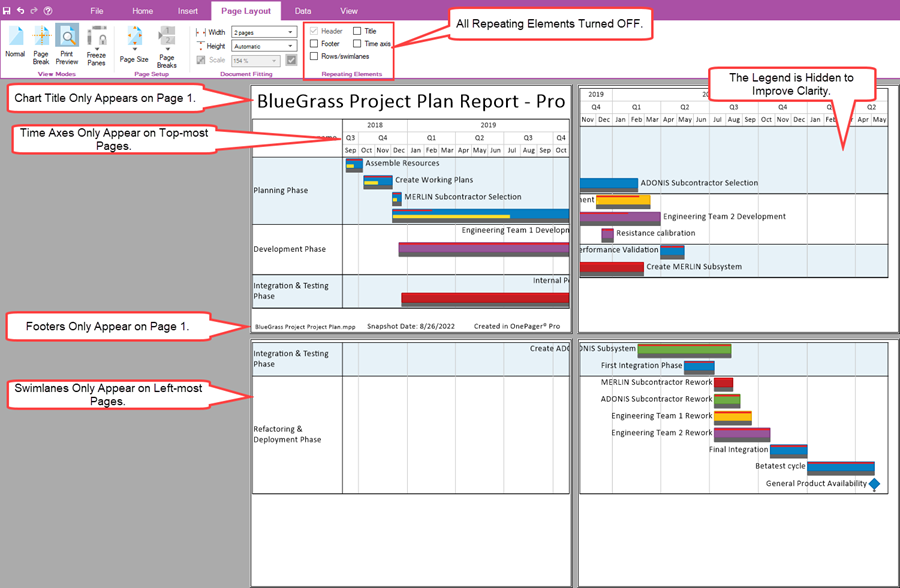
As a contrast, turning all the Repeating Elements OFF produces a Print Preview Mode that looks like this:
Related Links
| Ribbon Tool Bar - Home Tab | Ribbon Tool Bar - Insert Tab |
| Ribbon Tool Bar - Data Tab | Ribbon Tool Bar - View Tab |
| Ribbon Tool Bar - File Page | Ribbon Tool Bar - Supporting Controls |
(4.0.2.2.5-72)