Creating and Editing Rows and Swimlanes for Version 7.0 (Portal)
Contents
About Creating and Editing Rows and Swimlanes
1) Rows and swimlanes are a feature of OnePager that help you to group, collect, and sort project tasks and milestones dynamically based on your underlying project data.
2) This article covers how to represent rows and swimlanes in your charts and the manual edits that are available with rows and swimlanes.
2) Most row and swimlane editing is done globally, so you should also read the Editing with the Chart Properties form (Portal) 21.0.1-70 articles to familiarize yourself with some of the more common row and swimlane features.
Creating a Chart with Rows and Swimlanes
1) OnePager Pro and Express are distributed with a number of Templates that can be used to create various chart looks. Many of these Templates already have swimlanes defined. See the article at: Managing Templates (Portal) 24.0.1-70 for more information.
2) Our recommendation for first users of OnePager is to create your first chart with the format specified by the current Template. Once the chart is created, you have the capability to make edits including designating which source plan field should be used to control the creation of rows and swimlanes.
3) For the purpose of this article, we assume that you have created a chart without any visible rows or swimlanes and that you desire to organize your chart into swimlanes and provide at least one text column per row in the chart to display source plan information. Please review the Getting Started article at: Getting Started (Portal) 3.0-70 to see the creation of a chart with a swimlane.
Displaying Rows and Swimlanes
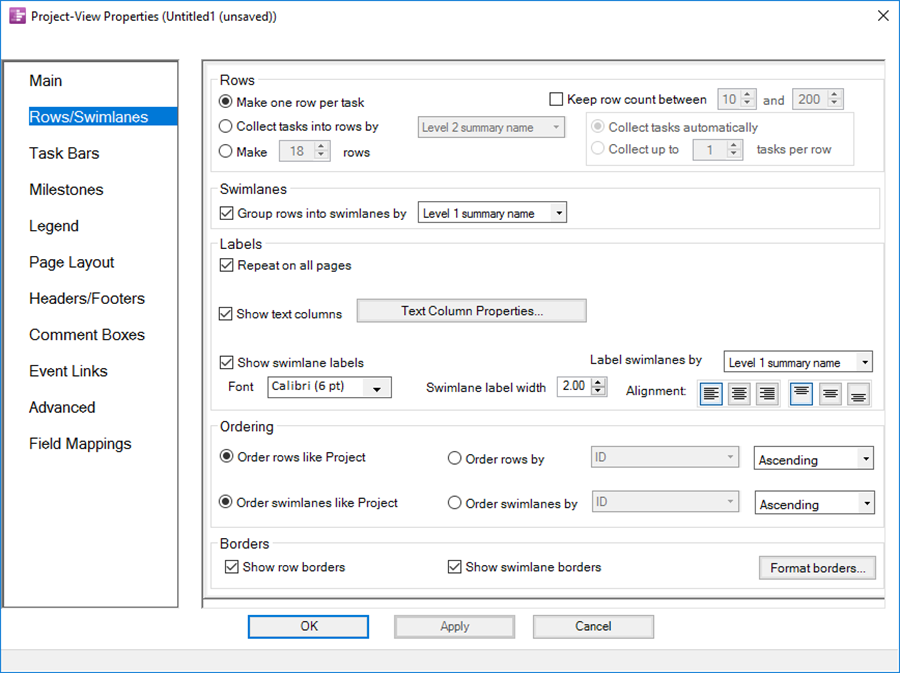
4) Assuming that your chart is created and displayed in the Chart Editor, you can now make the global edits necessary to display rows and swimlanes. This is done by clicking the Chart Properties button on the OnePager tool bar. This action accesses the form where you should click the Rows/Swimlanes tab as shown below:

5) As shown above, the Rows/Swimlanes tab is already configured to display the Level 1 summary name from the Microsoft Project source plan used in this illustration. For swimlanes these control setting creates multiple swimlanes and display text data taken from the source plan.
6) To display text columns of data for each row (from 1 to 5 are supported), you need to d a little extra configuring as follows:
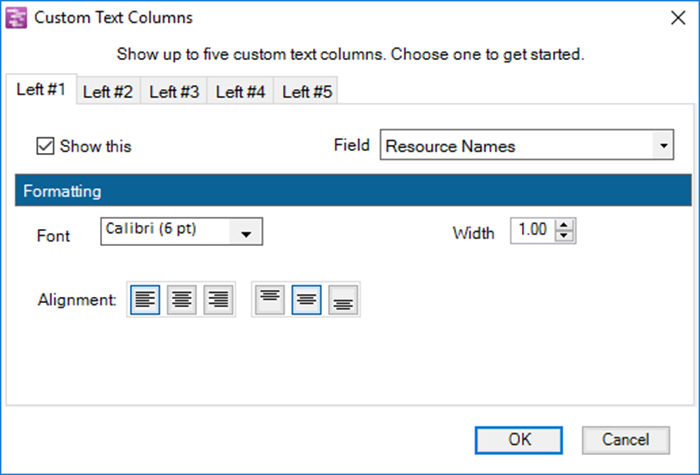
- a) Swimlanes are a collection of rows. To associate source plan data with each row go to the Show text columns checkbox and check it on. Next, click the Text Column Properties... button which immediately accesses the Custom Text Columns form as shown here:

- b) Above is the basic form. To specify one or more text columns for your chart, start with the Left#1 tab in the form and click the Show this checkbox. The Field window dropdown in the illustration above is already set to Resource Names. When you click the OK and return to the Rows/Swimlanes tab, the Resource Names data field from your source plan are used to provide associated text data in a column to the right of the Swimlane as shown below:

- c) You can now go back to the Custom Text Columns form and adjust the text in the Text Column by using the Formatting group in the form. You can also use the Left#2 to define an text column to support each row displayed in the chart.
Adding Swimlanes and a Text Column
7) To add one more text column to complete this example, suppose you want to also display for each row the %Complete value for each task in each row of the chart. This can easily be done as follows:
- a) Return to the Rows/Swimlanes tab, make sure that the Show text columns checkbox is checked on, and then click the Text Column Properties button again. This action takes you to the Custom Text Columns form where, for this illustration, you should click the Left#2 tab.
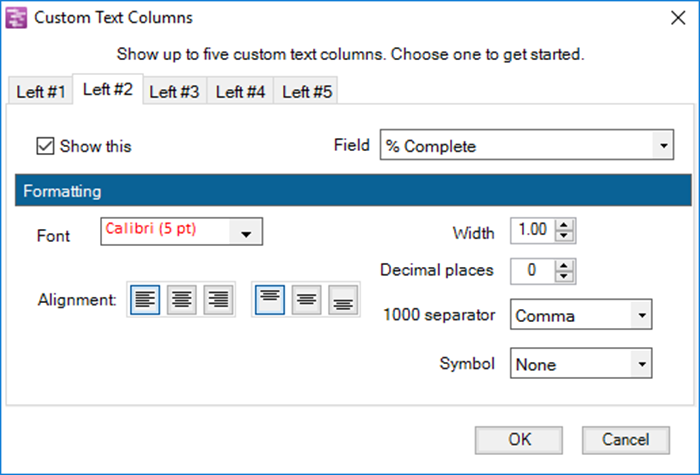
- b) Next, click the Show this checkbox and use the Field window's dropdown list to select %Complete as shown here:

- c) When you click the OK button on the form above, your chart is reconfigured to look like this:

8) The process of adding text columns can be repeated so that up to five (5) text columns can appear on the left side of the graph.
Displaying Large Numbers in Text Columns
9) Often when displaying cost data it is necessary to format the amounts with separators and currency symbols. As shown in the Custom Text Columns form above, when the Microsoft Project source plan field is numeric you have the controls necessary to insert commas or periods between groups of three digits in the numeric value as well as suppress the display of separators. Additionally, you have a control to select the currency type such as Dollars, Pounds, or Euros, for example.
- a) Suppose we have the following Microsoft Project source plan with the Cost field as shown below:

- b) What we'd like to do is display the Cost data so that it shows in an Text Column in the chart the way it looks in the Microsoft Project source plan.
- c) One way to do this is to first create the basic chart which is shown below:

- d) Now, click on the Chart Properties button on the tool bar, go to the Rows and Swimlanes tab, check the Show text columns checkbox, and click the Text Column Properties... button to bring up the Custom Text Columns form. Then, click the Left #1 tab and make sure that the Show this checkbox is checked. Finally, use the dropdown menu to the right to select the Cost field. These steps are shown in the illustration below:

- e) After completing these steps the Custom Text Columns form recognizes that the selected Microsoft Project source plan field is numeric and the form changes to look like this:

- f) The Comma is the default separator but the dropdown menu for the 1000 separator has three options as shown here:

- g) Since the values in the Cost field are in US Dollars, use the Symbol dropdown menu to select the Dollar symbol as shown below:

- h) After completing these steps, click OK on the Custom Text Columns form to close it; then click OK on the Chart Properties form. The chart is updated to look like this:

10) Once created, each Text Column cell can be individually edited or the entire set of cells can be edited as desired.
11) The minimum Width that can be set for any Text Column is 0.05 inches. Excessively wide Text Columns should be avoided as the space remaining for the graph is greatly reduced.
Editing All Rows and Swimlanes
1) As briefly discussed above, before the chart is created you can establish row and swimlane setting by accessing the Template form's Rows/Swimlanes tab. These setting are the same as discussed above. See the article at this link for more information on the Template Properties form's treatment of rows and swimlanes: Managing Templates (Portal). 24.0.1-70
2) Editing all rows and swimlanes can be done by using the Chart Properties form's Rows/Swimlanes tab. Once the chart is created, you can edit the properties of rows and swimlanes by clicking the Chart Properties button on the ribbion's Home tab. Next, navigate to the Rows/Swimlanes tab to access all the editing controls as shown below:

3) The actions described above apply equally to OnePager Express (OPX) as they do to OnePager Pro (OPP)
4) Caution: When collecting more than one task for display in a single chart row, OnePager (Pro and Express) displays only the source plan data associated with the left-most task in an Swimlane Label or Text Column. For more information consult the following reference link: Caution: Using Swimlane Labels and/or Text Columns When Collecting More that One Task Into A Row. 12.1.1-70
Editing Individual Rows and Swimlanes
1) Row and swimlane properties can be modified (or selected groups of them) by right-clicking on the row or swimlane label or by accessing the Rows and Swimlanes tab of the Chart Properties or Template Properties form. Access to row and swimlane editing tools can be done as follows:
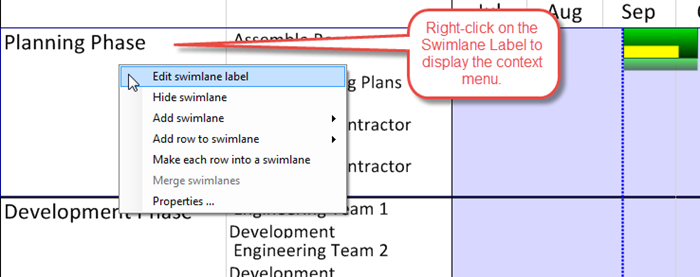
2) Right-clicking on a swimlane label:
- a) Right-click to select a swimlane (or group of swimlane).
- b) The context menu shown below is displayed:

- c) Descriptions of the controls within the above context menu can be found at the links referenced at the end of this article.
3) Right-clicking on any text column cell:
- a) Right-click to select a row (or group of rows).
- b) The context menu shown below is displayed:

- c) Descriptions of the controls within the above context menu can be found at the links referenced at the end of this article.
Links to Detailed Articles on Creating and Editing Rows and Swimlanes
More detailed information on editing rows and swimlanes can be accessed at the following article links:
(12.0.1-70)