Difference between revisions of "Using Presentation Mode with OnePager for Version 7.2"
(→Related Links) |
|||
| Line 240: | Line 240: | ||
| [[Linking Task and Milestones Using Manual and Data-Driven Task Links for Version 7.2 | Linking Task and Milestone Using Manual and Data-Driven Task Links (Portal)]] <!--19.0.1-72--> | | [[Linking Task and Milestones Using Manual and Data-Driven Task Links for Version 7.2 | Linking Task and Milestone Using Manual and Data-Driven Task Links (Portal)]] <!--19.0.1-72--> | ||
|- | |- | ||
| − | | [[The Chart Legend for Version 7.2 (Portal) | The Chart Legend (Portal)]] <!--15.0.1-72 | + | | [[The Chart Legend for Version 7.2 (Portal) | The Chart Legend (Portal)]] <!--15.0.1-72--> |
| [[Creating and Managing Curtains for Version 7.2 | Creating and Managing Curtains]] <!--16.0.1-72--> | | [[Creating and Managing Curtains for Version 7.2 | Creating and Managing Curtains]] <!--16.0.1-72--> | ||
|- | |- | ||
Latest revision as of 15:02, 26 March 2024
Contents
- 1 Introduction
- 2 Overview
- 3 Entering and Leaving Presentation Mode
- 4 Presentation Mode Controls
- 5 Presentation Mode Hover Box Feature
- 6 Presentation Mode Chart Editing Features
- 7 Related Links
Introduction
Illustrations used in this article are from OnePager Pro using data from Microsoft Project but the features, function, controls, and manual edits apply equally to other OnePager editions that import from data sources like Microsoft Excel, Smartsheet, Oracle Primavera P6, Project for the Web, Planisware Enterprise, Asana, and Wrike.
Presentation Mode is a new feature for OnePager and is available in all editions (e.g., OnePager Pro, OnePager Express, and OnePager Bundle). Using Presentation Mode you can switch from the Chart Editor smoothly to a high presentation quality screen that is suitable for schedule discussions in a meeting or for presentations to large audiences. While in Presentation Mode you have the capability to switch to different snapshots of your project, make editing changes to the chart, and revert smoothly back to the Chart Editor.
This article details how to launch Presentation Mode from the Chart Editor and to return to the Chart Editor. It covers the controls available specifically for using Presentation Mode to its fullest. Examples are provided to demonstrate all the features and controls available.
Overview
Presentation Mode is entered from the Chart Editor by tapping the F5 key on your keyboard. It is important to make sure that Microsoft Windows is focused on the OnePager application so that OnePager is aware of you making the F5 key stroke. Doing this puts the Chart Editor into Presentation Mode, displays the Presentation Mode controls briefly, and hides the OnePager ribbon tool bar giving Presentation Mode full access to your computer’s screen or wall presentation.
You can also enter Presentation Mode by clicking on the Present icon located in the Present section of the OnePager tool bar's View tab shown below. Once you are in Presentation Mode the OnePager tool bar is no longer available. The OnePager tool bar returns upon leaving Presentation Mode.
You can leave Presentation Mode at any time by tapping the Escape (Esc) key or by clicking the Exit button Presentation Mode control provided when your mouse is in the Presentation Mode frame. Again, it is important to make sure that Microsoft Windows is focused on the OnePager application so that OnePager is aware of you making the Esc key stroke.
Many chart editing features provided in the Chart Editor are available in Presentation Mode including access to the chart’s snapshots, time-axis editing controls, task bar/milestone symbol and decoration editing controls, and comment box creation/editing controls. Additionally, the enhanced hover box feature is turned ON for use in Presentation Mode.
This article provides detailed descriptions of Presentation Mode, its available controls, examples of how Presentation Mode looks on your screen, and how Presentation Mode can be effectively used to enhance your schedule conversations and presentations.
All examples and illustrations provided in this article are from OnePager Pro. However, Presentation Mode operates the same in all editions of OnePager (i.e., OnePager Express and OnePager Bundle). Presentation Mode is available for all source plan types supported by OnePager.
Entering and Leaving Presentation Mode
Caution on Entering and Leaving Presentation Mode
Function Key 5/Escape Key Option
To enter Presentation Mode you must tap the F5 key on your keyboard. This works when the focus of the Microsoft Windows operating system is focused on OnePager. If Microsoft Windows is focused on another running application, tapping the F5 key does not place OnePager in Presentation Mode. When leaving Presentation Mode by using the Esc key, again, Microsoft Windows must be focused on the OnePager application.
OnePager Tool Bar's View Tab Present Button/Escape Key Option
You can also enter Presentation Mode by navigating to the OnePager Tool bar's View tab and clicking on the Present Icon in the Present section of the View tab. Upon doing this, the Chart Editor enters Presentation Mode and the OnePager tool bar's View tab disappears. The OnePager tool bar's View tab is shown below:

Presentation Mode Capabilities
As mentioned above, Presentation Mode is available in all editions of OnePager from the OnePager Chart Editor as shown in the annotated illustration below of a chart oriented vertically:
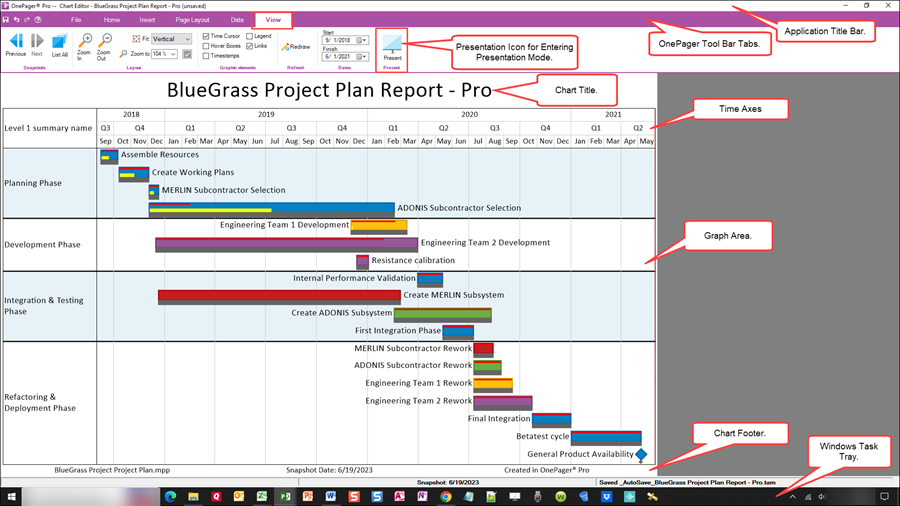
The full components of the OnePager Chart Editor screen are shown above including those components that are provided by OnePager and by Microsoft Windows. In Presentation Mode, several of the components shown above are hidden so that the remaining components, principally the Chart title, Graph area, and Chart headers/footers, if any, are visible as shown here:
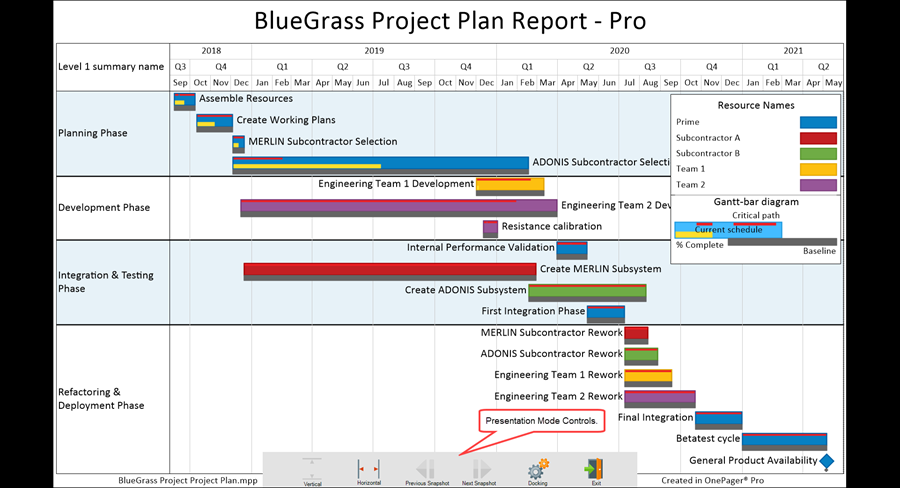
The chart is centered in the screen area and the Presentation Mode controls appear (by default) in gray at the bottom center of the screen. The Presentation Mode controls are visible temporarily and are hidden after fifteen (15) seconds. The Presentation Mode controls can be unhidden by moving the mouse anywhere into the chart area.
If the orientation of the chart in the Chart Editor was set to horizontal, entry into Presentation Mode displays the chart horizontally as well. If the Presentation Mode display of the chart with horizontal orientation is too large for the screen, OnePager provides vertical and horizontal scroll bars as necessary.
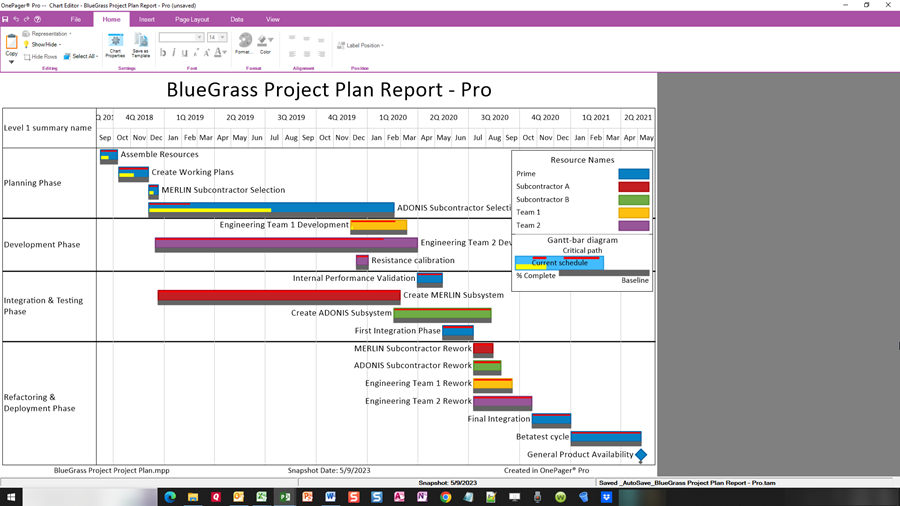
The Presentation Mode controls are discussed later in this article but for now we draw your attention to the Presentation Mode control button on the far right of the set. This is the Exit control button that looks like a doorway with an arrow pointing to the right. Clicking the Exit button immediately exits from Presentation Mode back to the Chart Editor. As mentioned above, you can also tap the keyboard’s Esc key to achieve the same result as shown below:
Presentation Mode Controls
Presentation Mode controls are located by default at the bottom center of the Presentation Mode display. They initially appear when Presentation Mode is first entered when the F5 key is tapped. There are six (6) controls discussed below.
Enabled and Disabled Presentation Mode Controls
For the six (6) Presentation Mode control buttons shown below, buttons that are enclosed in gray boxes are disabled. As the example below shows, the Vertical, Previous Snapshot, and the Next Snapshot buttons are disabled.

Vertical and Horizontal Buttons
In the illustration above, the Vertical, Previous Snapshot, and Next Snapshot buttons are disabled. Either the Vertical or Horizontal buttons is disabled depending upon which orientation the chart is shown in the Chart Editor. As shown above, if the chart orientation is Vertical in the Chart Editor, only the Horizontal orientation button is enabled and can be selected. If you select and click the Horizontal button in Presentation Mode, the orientation is changed and when you return to the Chart Editor, the chart is in a Horizontal orientation.
Previous Snapshot and Next Snapshot Buttons
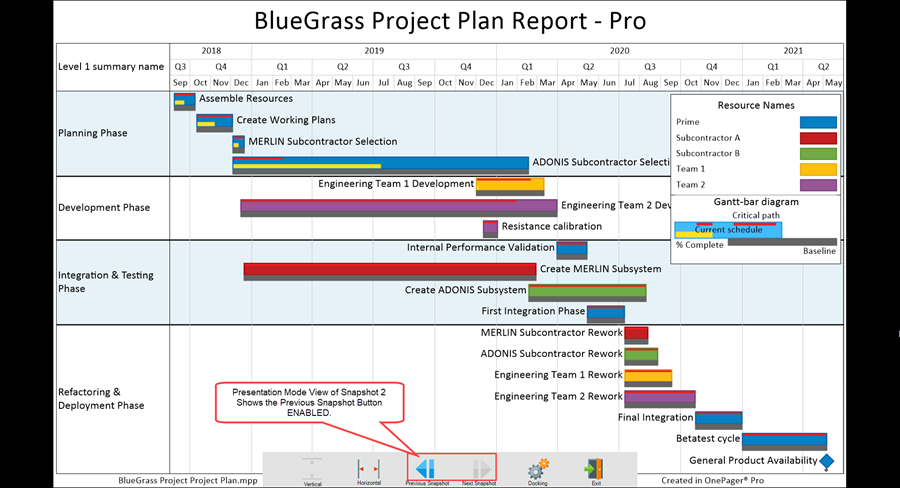
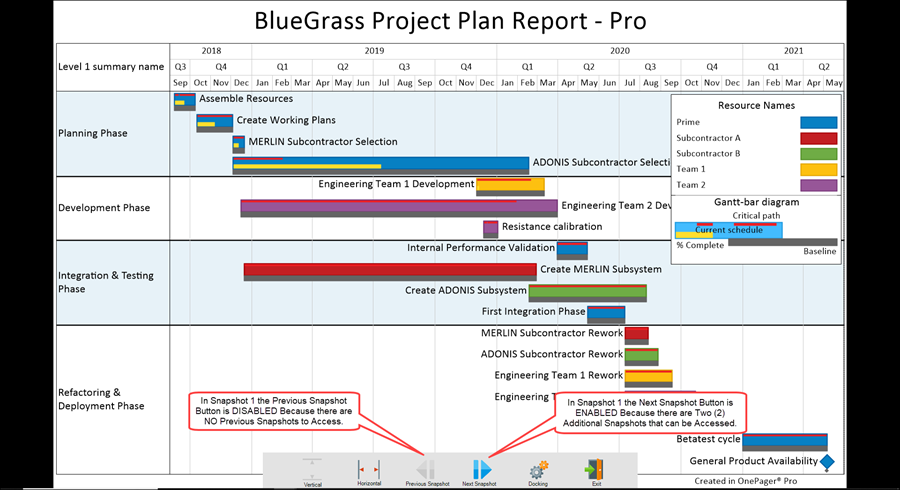
The Previous Snapshot and Next Snapshot buttons are disabled when the chart consists of only one snapshot. When there are two or more snapshots, the Next Snapshot button is enabled if the chart being displayed in the first snapshot. Likewise, the Previous Snapshot button is enabled if the chart being displayed is the second or later snapshot. If there are three or more snapshots and a middle snapshot is being displayed, both the Previous Snapshot button and the Next Snapshot button are enabled.
Docking and Exit Buttons
The Docking and Exit button by their very nature are always enabled.
Presentation Mode Exit Control
The Exit button is on the far right of the six (6) control set as shown below:
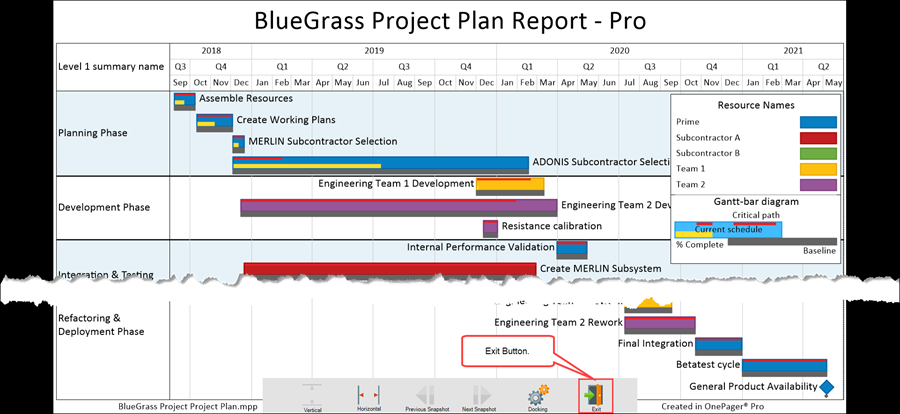
Clicking the Exit button immediately leaves Presentation Mode and returns to the normal operation of the Chart Editor as shown in the previous sub-section.
Presentation Mode Docking Control
The Docking button is the second button from the right and is used to reposition the Presentation Mode controls to any of the six (6) predetermined positions on the screen. Clicking the Docking button accesses a context menu as shown here:

The default position is Bottom center. Clicking any of the other five (5) position options immediately repositions the Presentation Mode controls to that position as shown below where the Top left position is selected as an example:

The Docking button can be clicked at any time the Presentation Mode controls are unhidden and the position of the controls can be changed. No matter where you position the Presentation Mode controls they are automatically hidden after fifteen (15) seconds unless you place the mouse cursor into the chart area whereby the Presentation Mode controls are unhidden again.
Presentation Mode Vertical Control
The Vertical button is located on the left end of the set of Presentation Mode controls. The Vertical orientation centers the Presentation Mode chart in the middle of the screen between two black areas as shown above in most of the illustration used to this point. The Vertical button is shown below as the current orientation since it is disabled:

Presentation Mode Horizontal Control
The Horizontal button is located to the right of the Vertical button and is used to horizontally position the Presentation Mode chart display on the screen. Taking the example shown above, if we click the Horizontal button, the Presentation Mode chart looks like this:
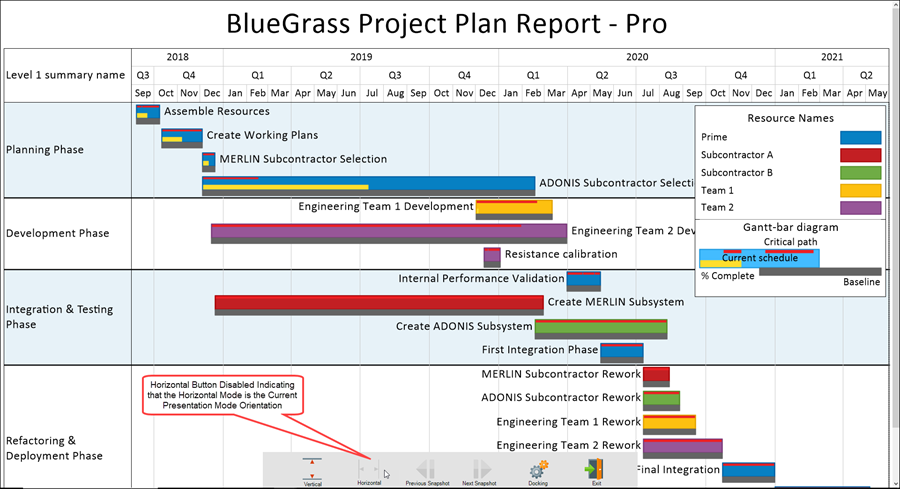
The Horizontal orientation typically fills the entire viewing area as in the case shown above. Since it is not possible, in the above example, to display the entire chart in Horizontal orientation, OnePager provides a vertical scroll bar so you can reposition to other area of the chart. Your mouse is always active in Presentation Mode so it is possible to use the mouse to move the vertical scroll bar up and down as needed.
If you are in the Horizontal orientation you can easily revert back to the Vertical orientation by clicking the Vertical button. When this action is taken, the Presentation Mode chart looks like this:
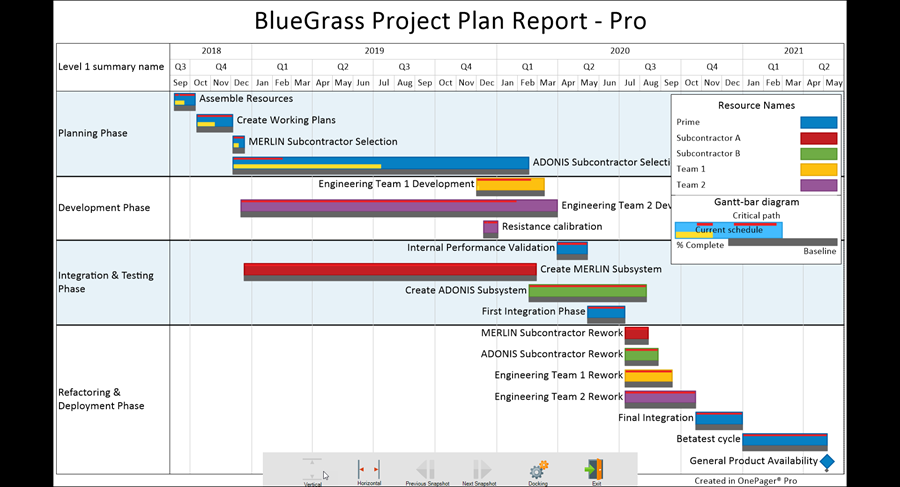
Presentation Mode Snapshot Access Controls
All the previous illustrations in this article used a OnePager chart with only one snapshot. Accordingly, both the Previous Snapshot and Next Snapshot buttons are disabled. If we expand our example to include multiple snapshots, say three (3) snapshots, the Presentation Mode controls appear as shown in the illustration below for the middle snapshot:
If we click the Previous snapshot button in order to navigate to the first snapshot in the set, the Presentation Mode screen and the Presentation Mode controls look like this:
If we navigate to the third snapshot in the set by clicking the Next Snapshot button twice, the third snapshot in the set is displayed and the Presentation Mode controls look like the screen shown below:
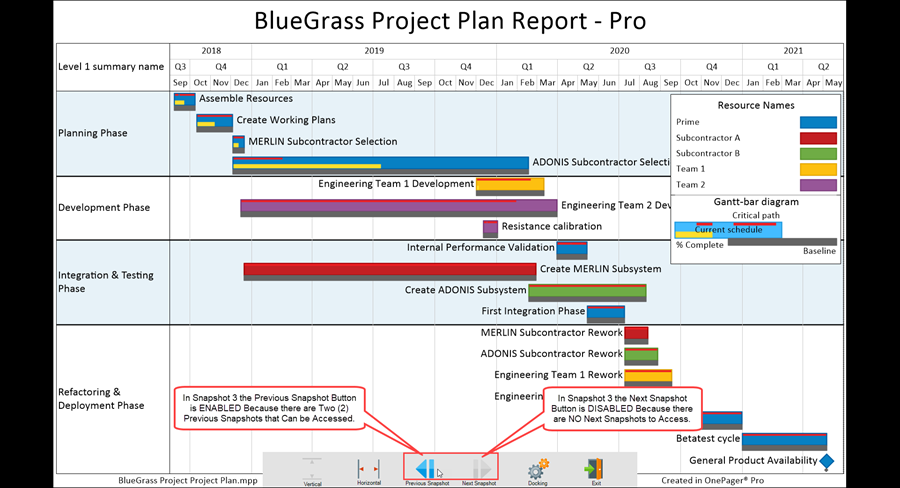
The Previous Snapshot and Next Snapshot buttons operate the same as the corresponding button on the View tab of the OnePager tool bar. When you exit Presentation Mode either by using the Exit button or the Esc key, the Chart Editor displays the snapshot that was current in the Presentation Mode.
Presentation Mode Hover Box Feature
You have the capability to use the Hover Box in Presentation Mode as long as you've turned the Hover Box feature ON by checking the Hover Boxes checkbox on the View tab of the OnePager tool bar as shown below:
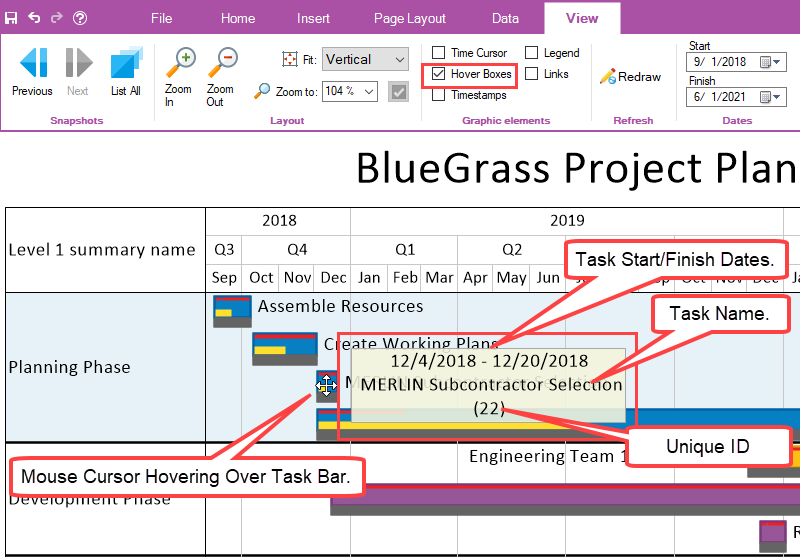
In Presentation Mode, the Hover Box feature is available for use in group schedule discussions or schedule presentations when you mouse over a task bar/milestone symbol or text name label.
Standard Hover Box
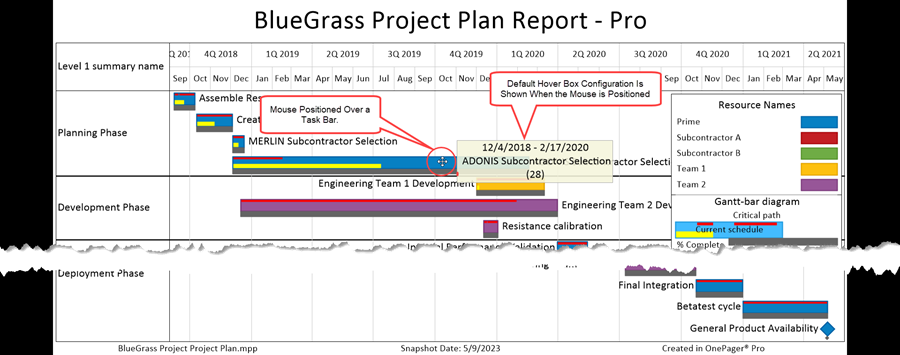
In Presentation Mode, the standard Hover Box is always available when you move the mouse over a task bar/milestone symbol or text name label as shown here:
Hover Box Custom Text Feature
You can modify the contents of the Hover box by going to the Chart Properties form’s Comment Box tab before entering Presentation Mode and change to custom field to take the place of the default content configuration of the Hover Box as shown below:
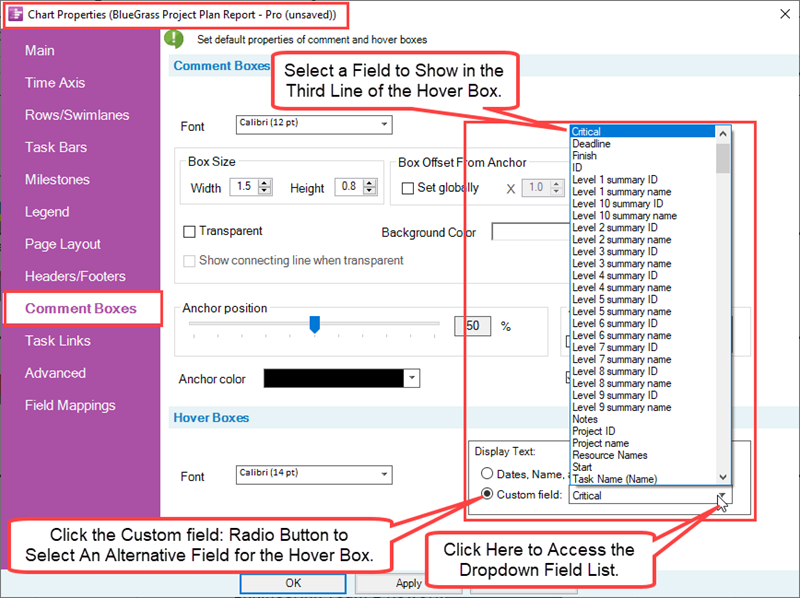
When this change is made in the Chart Properties form, the content of the Hover Box contains the value of the selected custom field for the task bar/milestone symbol hovered over shown below as illustrated in Presentation Mode:

Using the Hover Box custom text feature, shown above, the value of the Critical field for the task bar shown above is True because the task bar contains a critical segment.
For more information on the use of the Hover Box with the Custom Text feature, please see the referenced article at:
| Hover Box with Custom Text Feature |
Presentation Mode Chart Editing Features
In Presentation Mode you do not have the OnePager ribbon tool bar set available to assist with editing in the chart. However, OnePager does support most editing features that can be accomplished through right-click context menus and accessible forms as discussed in this section.
Time-Axis Editing
In Presentation Mode you can left or right-click on any time-axis cell and perform the same editing functions as are supported by the Chart Editor. These editing functions include left-clicking in a time-axis cell to select it and stretch the time-axis cell. Using the right-click you can access the right-click context menu and use any of its five (5) commands including accessing the Time Axis Cell Properties form. All the editing functions available in the Time Axis Cell Properties form can be used on the selected time-axis cell.
If you click the Time-axis properties… command in the time-axis cell right-click context menu, OnePager accesses the Chart Properties form’s Time Axis tab where you can make global edits to the time-axis. Any global edits you might make in the Chart Properties form’s Time Axis tab are immediately applied to the Presentation Mode chart and are retained by the Chart Editor when you exit Presentation Mode. Note: Accessing the Chart Properties form in Presentation Mode is not recommended.
Because the OnePager ribbon tool bar is hidden, you do not have access to the UNDO/REDO buttons so you cannot Undo any editing changes you make while in Presentation Mode.
Task Bar/Milestone Symbol Editing
Editing task bar/milestone symbols in Presentation Mode is supported by OnePager as well. You can left or right-click on any task bar/milestone symbol and/or their related task bar/milestone symbol text name label to select them, access their associated right-click context menu, and exercise any of the right-click context menu commands enabled in these context menus. You also can access the task bar/milestone symbol’s Change Task/Milestone Properties form and all the tabs supported on that form.
The Chart Properties form is not accessible from task bar/milestone symbols in Presentation Mode which is the same as in the Chart Editor.
Because the OnePager ribbon tool bar is hidden, you do not have access to the UNDO/REDO button so you cannot Undo any editing changes you make in Presentation Mode.
Editing in the Graph
All editing features that are available in the Chart Editor with respect to editing rows and swimlanes and editing capabilities accessed by right-clicking in empty space in the graph are supported by OnePager in Presentation Mode.
You can select rows and swimlanes, reposition rows and swimlanes, access their right-click context menus, and where the command is available, access the Chart Properties form for global edits. Note: Accessing the Chart Properties form in Presentation Mode is not recommended.
Because the OnePager ribbon tool bar is hidden, you do not have access to the UNDO/REDO button so you cannot Undo any editing changes you make in Presentation Mode.
Legend Editing
OnePager supports editing of the Legend and individual Legend items in Presentation Mode to the same extent that is available in the Chart Editor. The Legend can be selected, repositioned by manual drag and drop, resized, and edited using the supported right-click context menus and associated forms. Edits to the Legend are applied to associated task bar/milestone symbols in the same way as these edits are applied in the Chart Editor.
Because the OnePager ribbon tool bar is hidden, you do not have access to the UNDO/REDO button so you cannot Undo any editing changes you make in Presentation Mode.
Caution When Editing with the Chart Properties Form
As mentioned in some of the previous sub-sections, you have access to the Chart Properties form through various right-click context menus. Although all the editing features of the Chart Properties form are available, we caution that any changes in the Presentation Mode are going to be reflected and maintained in the Chart Editor.
The Presentation Mode is intended to serve your group schedule discussion and large audience presentation needs which may not be well served when extensive editing to the chart is performed in this mode. Given that the UNDO/REDO function is not supported in Presentation Mode, situations may arise where extensive editing in Presentation Mode hinders the communication goals intended. In other words: We don’t recommend employing the Chart Properties form in Presentation Mode.
Related Links
| Presentation Mode |
(23.6.1-72)